|
Introduction
Corelyzer is a collaborative electronic workbench for the analysis of
cores of seabed and lake sediments, soil, hard rock and ice. It is a
software
tool from the Corewall
project.
The aim of Corelyzer is
to increase the efficiency of scientific core analysis and description,
and to
make the dissemination of results quicker, for example between ship and
shore, and within international collaborations. It also aims to
increase linkages between research into different cored media like ice
and sediments.
The
stratigraphic and
core image data content of dbSEABED is obviously a candidate for use in
Corewall. This web page shows a use of dbSEABED data in Corelyzer. The
chosen example is the TAMU Gulf of Mexico piston core dataset (Project Link).
Stratigraphic and core data collections can be difficult to comprehend,
given their 3D and sparse structure. The goal of CoreNavigator is to
make core datasets more comprehensible and workable.
A visual indexing of the TAMU dataset, access to the data with
Corelyzer sessions is given through CoreNavigator (KML version) at KML
Project. This is a product of dbSEABED processing of the TAMU
core collection.
Use
of the kmlCoreNavigator
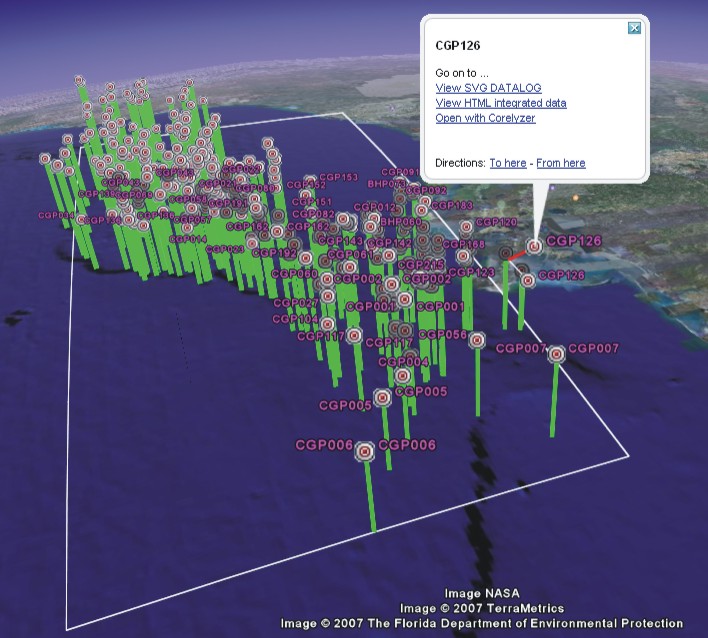
Begin with the Project
URL which in most browsers will open a Google Earth (ver. 2+)
display. The
piston cores are shown projected up from the sea surface, with lengths
proportional to recovery.
Clicking on the placemark icon raises a text bubble, with options to
view a SVG (Scalable Vector Graphic) log of the data which is available
for the core, an HTM (web browser) page listing the data values, and a
link to a CML (Corelyzer) file. Plugins will need to be installed on
the user's local machine to view the SVG and
start Corelyzer.
Use
of the CoreLyzer display
Details of Corelyzer are available at a Wiki.
Corelyzer installation sets CML as a
MIME type, so opening a CML file starts Corelyzer. Corelyzer is best
used in a multi-screen display (Example).
The initial Corelyzer display will contain a core image and a sensor
(i.e.,
measurement) track, with annotation (A) marks. In the display, green
(point) annotations mark section tops, and the
blue mark levels of string dbSEABED output data. Numeric outputs are
rendered to the graphical Sensor Tracks.
vrmlCoreNavigator
Variant
A VRML (Virtual Reality Modeling Language) CoreNavigator exists in
addition to the KML. This fly-through presentation
(Example 1, Example
2) is more suitable for local-machine
comprehension and browsing of complex core datasets. Lithologies
are represented and undividual core units can be interrogated by mouse
and rollover. Cores are hung from the seabed, with various visual
components representing recovery, penetration, and lithological units.
The VRML CoreNavigator of the TAMU piston core dataset may be obtained Here.
Notes on development
The Google Earth and Corelyzer projects were computed using programs in
dbSEABED, and from the integrated dbSEABED data. Image strips for
each core section were taken from photos of the
sections in racks using dimensions compiled in EXCEL and image cutting
in Imagemagick.
The observational data, organized at sample resolution in GIS format
(X, Y, Z, phase coordinates) was broken into subfiles, one per core.
Only cores with >0.3m penetration were treated as cores. At this
stage HTM, TXT data summaries were formed, and SVG graphical logs of
the data were drawn.
Potentially, the KML and CML generating programs used here could be
applied to non-dbSEABED datasets. It is necessary to have well
organized data and core images (strip or rack).
The
Project
Corewall is a project of the Universities of
Minnesota2, Illinois at
Chicago3, and Colorado1
and Columbia University. Corewall is a NSF and JOI funded
project. dbSEABED is a collaborative project based at the University of
Colorado.
Other Technical Notes:
1. Corelyzer Version 0.8.7.01 (or
later) must be installed to operate all of CoreNavigator.
2. A plugin for SVG (Scalable Vector Graphics) is needed to
operate all of CoreNavigator. Adobe SVG Viewer is
suitable.
3. To display the VRML CoreNavigator a plugin will be needed. The
Parallelgraphics Cortona is
suitable.
4. Note
that
the core photos for the TAMU dataset, which were taken as a rack of
sections, have relatively poor resolution at
the level
of core section.
5. To generate the project, Windows XP
operating system was used on INTEL machinery.
6. The Corelyzer CML and XML syntax is fully documented at This
Link.
7. At start-up for Corelyzer session, only
one sensor
track is shown. To change the parameter which is plotted: (i) click the
Corelyzer icon (third in top left) to start the
tool window, (ii) right click the Data layer, (iii) draw a graph by
working through the graph setup window ( Screen
Image; Final
Display).
8. A problem viewing SVG datalogs from Google Earth can be worked
around by setting "SeparateBrowserWindow"in the GE Options.
9. An intermittant problem with the sensor track failing to plot on
startup of
Corelyzer, is under investigation. It seems to appear in installations
of Corelyzer that have a large cache collection.
10. Report difficulties and suggestions to: julian  evl.uic.edu.
|
Click any
to enlarge)


|