Overview
PURPOSE
The Bering Land Bridge animation was created to assist with scientific research of environmental change, sea-level history, and the migration of humans, flora, and fauna into the Americas after the Last Glacial Maximum. The visualization, and associated GIS layers, could also be useful for earth science education and public outreach.
SUMMARY
About 21,000 calendar years before present, glaciers and ice-sheets covered much of the northern high latitudes of North America, Europe, and Asia. Freshwater locked in the ice sheets caused global sea level to stabilize approximately 120 m below its present level (e.g., Clark and Mix, 2002). For thousands of years, the Bering Land Bridge existed as a broad treeless lowland connecting eastern Siberia and Alaska (Hopkins et al., 1982). The vast expanse of tundra vegetation, scattered shrubs, and shallow ponds experienced cold winters in a dry, windswept continental climate (Elias et al., 1996, 1997).
The land bridge was an effective corridor for mammals (including large herbivores such as the wooly mammoth), other fauna, and flora to migrate east or west. Paleoindian hunter gatherers – the first humans to enter the New World – moved across the land bridge, or along its coasts, into North America about 14,000-12,000 years ago (Dixon, 2001; Yesner, 2001). As the world's glaciers and ice sheets melted at the end of the last glaciation, rising sea level inundated the land bridge. The terrestrial connection between the continents was lost roughly 11,000 years ago when sea level rose to a level about 48 m below present, as the Bering Strait was formed between the Bering and Chukchi Seas. Finally, as sea level approached its modern position, the former land bridge was transformed into the shallow marine environments of a broad continental shelf.
This description is a simplified summary of evolving knowledge revealed over the past thirty years through scientific research. Although a basic understanding of the land bridge is established, further research is needed to address such issues as: timing of sea-level rise and the creation of Bering Strait; human and animal migration into and from the New World; environmental and climate processes and feedbacks. For an example of active research on these themes, see "Marine Climate and Relative Sea Level across Central Beringia", as well as a Jan. 2003 Geotimes article, "Investigating an Arctic Gateway" (Brigham-Grette et al., 2003).
In the meantime, spatial analyses with Geographic Information Systems (GIS) can take advantage of available information for visualization of the evolving land bridge. Analysis of seafloor bathymetry also reveals how quickly the land bridge changed with rising sea level (Figs. 1 and 2 below).
Land Bridge Area and Sea-Level Rise after the Last Glaciation
 |
|
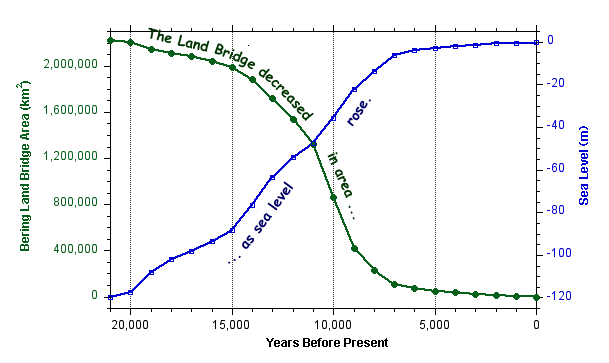
Figure
1. Changes in the area of the land bridge as sea level rose. About
21,000 years ago, when sea level was about 120 m below present (blue
line and right axis), the land bridge covered approximately
2,215,000 km2 (green
line and left axis). The land bridge decreased
in area as sea level rose over the following thousands of years.
|
Former Land Bridge Area versus Depth
 |
|
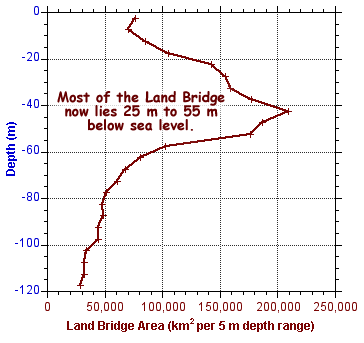
Figure
2. Relationship between the area of the now-submerged land bridge
and depth below present sea level. Nearly half of the former land
bridge (48%) was a low-lying tundra plain that now exists 25 m to
55 m below sea level.
|
UNCERTAINTIES
The animation, maps, and graphs presented here are preliminary, due to uncertainties related to sea-level history, bathymetry, and postglacial sea-floor changes. For example, the sea-level curve shown in Fig. 1 is a generalized "global" sea-level curve (in calendar years BP; see "GIS Processing" below for more details). A more accurate, regional sea-level curve will be determined with radiocarbon dating of marine cores, as part of an NSF-funded project on "Marine Climate and Relative Sea Level across Central Beringia". Also, sea-floor topography is not well resolved; linear artifacts and minor vertical errors are apparent in the source ETOPO2 dataset. Finally, the animation does not take into consideration vertical motion of the crust (tectonic activity or isostatic compensation), and possible deposition or erosion on the sea-floor by waves or currents as sea level rose. In sum, each timeslice is accurate to about ± 1500 yr.
However, the maps and graphs presented here take advantage of the best information currently available. Spatial patterns of the evolving land bridge are robust at the scale presented in the animations.
GIS AND GRAPHICS PROCESSING
Standard techniques using Geographic Information Systems (GIS) were used to model the flooding of the land bridge, applying an assumed sea-level curve to digital bathymetry of the modern seafloor. The first step was to create a Digital Elevation Model (DEM), including bathymetry. The source data, the ETOPO2 Dataset, was converted from a geographic coordinate system to a UTM projection with 2 km grid-cell spacing. Areas east and west of the international dateline (180 deg.) were converted separately, then merged together. See the metadata files accompanying the DEM for more details. Land bridge area is defined as the extent in the DEM of areas 0-120 m below sea level.
The animation was created using a variety of software packages. The DEM was imported into MFWorks, a simple raster GIS. Coastlines were identified for modern sea level and -120 m. Sea-levels for 1000-calendar-year steps were determined from a generalized eustatic sea level curve (based on the sea-level history of Barbados; see Bard et al., 1990; Lambeck et al., 2002; Peltier, 2002). The DEM, with coastlines, was processed with an MFWorks script to export .tif files with color gradients custom-applied for each time step. The .tif files were labeled in GraphicConverter and Fireworks, imported as a file sequence into Quicktime Pro, and exported with high quality, Photo-JPEG compression as Quicktime movie files at three screen resolutions.
REFERENCES
Bard, E., Hamelin, B., and Fairbanks, R.G., 1990, U/Th ages obtained by mass spectrometry in corals from Barbados: Sea level during the last 130,000 years: Nature, v. 346, p. 456-458.
Brigham-Grette, J., Keigwin, L., and Driscoll, N., 2003, Investigating an Arctic gateway: Geotimes, v. 48, p. 20-23.
Clark, P.U., and Mix, A.C., 2002, Ice sheets and sea level of the Last Glacial Maximum: Quaternary Science Reviews, v. 21, p. 1-7.
Dixon, E.J., 2001, Human colonization of the Americas: timing, technology, and process: Quaternary Science Reviews, v. 20, p. 277-299.
Elias, S.A., Short, S.K., Nelson, C.H., and Birks, H.H., 1996, Life and times of the Bering land bridge: Nature, v. 382, no. 6586, p. 60-63.
Elias, S.A., Short, S.K., and Birks, H.H., 1997, Late Wisconsin environments of the Bering Land Bridge: Palaeogeography, Palaeoclimatology, and Palaeoecology, v. 136, p. 293-308.
Hopkins, D.M., Matthews, J.V., Schweger, C.E., and Young, S.B., eds., 1982, Paleoecology of Beringia: Academic Press, New York, NY.
Lambeck, K., Yokoyama, Y., and Purcell, T., 2002, Into and out of the last glacial maximum: sea-level changes during oxygen isotope stages 3 and 2: Quaternary Science Reviews, v. 21, p. xx.
Peltier, W.R., 2002, On eustatic sea level history: Last Glacial Maximum to Holocene: Quaternary Science Reviews, v. 21, p. 377-396.
Yesner, D.R., 2001, Human dispersal into interior Alaska: antecedent conditions, mode of colonization, and adaptations: Quaternary Science Reviews, v. 20, p. 315-327.