carbo*
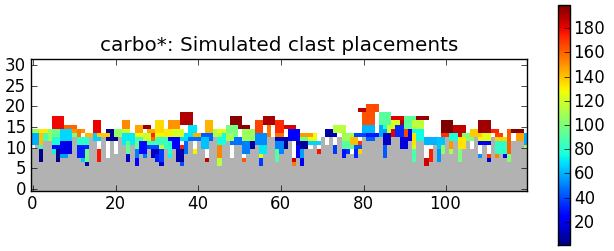
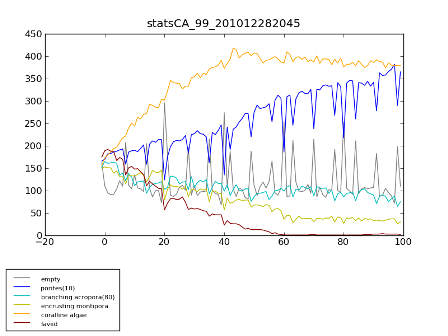
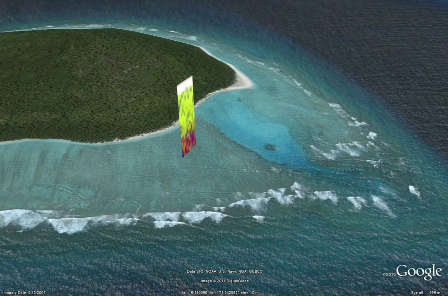
Numerical Modelling of Benthic Carbonate Production

Chris Jenkins 1, Peter Burgess 2, Donald Potts 3

1. INSTAAR, CU Boulder; 2. Royal Holloway, UC London; 3. UC Santa Cruz


This page displays some recent carbo* output types,
in preparation for the May 2014 event:

 
CSDMS 2014 annual meeting

4890474641 4db5952ed4 o Let Ideas compete.jpg
'
Boulder Colorado, United States
20 - 22 May 2014


* Poster presentation, May 2012


* Images of recent outputs, March 2014:

Figure 1. Output from a clast placement simulation, relevant to extreme weather breakage of skeletons. The clasts falling onto rough (creviced) substrate create a porosity, but also opportunities for smaller particles to infiltrate. The clasts have different shapes and are coloured sequentially, blue earlier, red later in the event.
Figure 2. Output showing the changing blend of carbonate producers for a south Molokai model run.
Figure 3. Progress of the community elements, modelled with Lotka-Volterra methods, over 100 years, with punctuating events. There is a spin-up period at the start of the run.
Figure 4. Thickness-stratigrapic profile through a modeled area, with timelines (white).
Figure 5. Outputs can be rendered to an easily mappable, customizable project environment such as Google Earth. This example, Chagos Bank, Indian Ocean.


CJJ INSTAAR 6 March 2014