Alaska Geospatial Climate Animations
Patterns for Precipitation
After an Introduction frame and a map of Alaska, the precipitation animation shows a series of color-coded maps:

In this series, each month uses the same "annual" color scale -- from only 0.1 inches (in) for brownish orange, through yellow, green, blue, and dark blue to 45.8 in for dark purple. In other words, the orange and yellow colors show drier conditions, whereas the blue and purple colors show wetter conditions. The twelve frames highlight absolute change in rainfall and snowfall (in mm and in, water equivalent) through the seasons. As the animation begins, Alaska moves toward it's driest month, April. Once summer begins, green and blue colors spread across the state as precipitation increases. Alaska's wettest months are August and September.
 |
Next to each month's color scale is an arrow that shows the average precipitation across the state for that month. For example, the average amount of precipitation in Alaska for January is 2.5 in. The "avg." arrow moves down and up the color scale as the animation continues. |
This series of maps also shows patterns in spatial variability. For example, the northern part of the state (north of the Brooks Range, on Alaska's North Slope), remains an "Arctic desert" year-round, with only 4-8 in of total annual rain or snow. In contrast, the coast ranges along the Gulf of Alaska are "wet" year-round, with as much as 335 in of total annual rain and snow. This is illustrated below for two weather station sites:
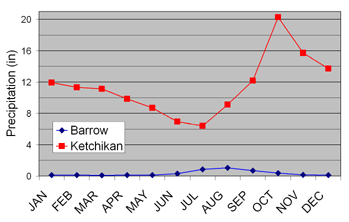 |
The graph at left shows that Barrow receives less than an inch of rain or snow each month, compared to much wetter and snowier conditions for Ketchikan, at the southeastern tip of the panhandle. Data from the Alaska Climate Research Center (1971-2000 Normals). |
Spatial variation in precipitation is due mainly to three factors: elevation, continentality (proximity to sources of moisture), and the effect of rain shadows:
|
 Elevation |
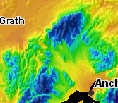
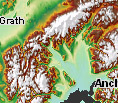
Precipitation generally increases with elevation -- drier in the lowlands and rainier or snowier for uplands and mountain peaks. The Alaska Range (at left) shows this relationship clearly. March precipitation ranges from less than 1 inch for Anchorage, at sea level, to greater than 8 inches for Denali, the highest peak in North America. |
|
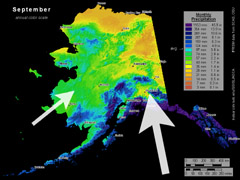
Precipitation also decreases with distance from large sources of moisture. The large white arrow at left symbolizes how moisture derived from the Gulf of Alaska travels inland as water vapor in storm clouds, but falls as rain or snow close to the coast. Storms carry less moisture as they continue to the north and northeast, leaving the continental interior relatively dry. The smaller white arrow illustrates that the Bering Sea is a less significant source of moisture. As an aside, the Arctic Ocean is not an important moisture source, mostly because evaporation is limited by sea ice for much of the year. |
|
 Elevation |
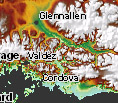
On a more detailed scale, an important factor is the presence of "rain shadows". For example, as storm clouds move northward across Cordova (at left), moist air masses are forced upward by the coast ranges. Due to this "orographic lifting", water vapor condenses and falls as rain or snow, leaving the "downwind" side of the ranges drier. In May, Glennallen receives one-thirtieth the precipitation that falls at the same elevation near Cordova. |
|
 Elevation |
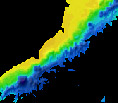
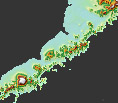
Another strong precipitation shadow lies on the northwest side of the Alaska Peninsula (south of Dillingham, at left). The Bering Sea coast in this area receives only 1 inch of rain in May, compared to more than 5 inches for the coast along the Gulf of Alaska. |
Play the animation to see how these three factors change through the year. (And skip to the end of the animation to view how the patterns hold for total annual precipitation).
The precipitation animation next shows a second series of color-coded maps:

In this series, precipitation is shown at each location as the monthly percent of the annual total. Thus, brownish-orange to yellow colors show areas that are drier in that month compared to an average month of rain or snow for that location. Blue and purple colors highlight locations for months that are wetter than average. Rainfall and snowfall are shown in this way, in a relative sense, to highlight seasonality.
|
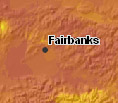
For example, April is a relatively dry month for the Fairbanks area (at left). It receives only about 3% of its total annual precipitation in April. An average month would be 8.3% (= 100% / 12 months). This compares to August, a relatively wet month (at right), when it receives about 18% of its annual total. However, in absolute terms (of mm or in), Fairbanks is a fairly dry part of Alaska, even in August. |
|
Thus, for Alaska in general, January through April are relatively dry months. Most of the precipitation that falls in the interior occurs during summer. Precipitation along the southern fringe of the state is less seasonal in nature. This is illustrated below for two weather station sites:
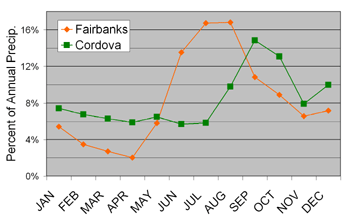 |
The graph at left shows that Fairbanks (in the interior) receives most of its moisture in the summer. In contrast, Cordova (on the Gulf of Alaska) experiences a peak in the fall, with less overall variation through the year. Data from the Alaska Climate Research Center (1971-2000 Normals). |
The animation ends with a map of total annual precipitation. Refer to section above on spatial variability to review influences such as elevation, continentality, and rain shadows. And note the extreme climate gradient from "wet" coastal ranges to the Arctic Desert.
Alaska Geospatial Climate Animations
