Alaska Geospatial Climate Animations
Patterns for Temperature
After an Introduction frame and a map of Alaska, the temperature animation shows a series of color-coded maps:
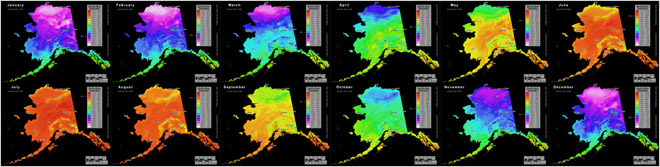
In this series, each month uses the same "annual" color scale -- from -24°F for white, through purple, blue, green, yellow, and orange to 63°F for red. In other words, the purple and blue colors show colder, winter conditions, whereas the orange and red colors show warmer, summer conditions. The twelve frames highlight month-to-month change, and show the extreme temperature wave that sweeps over Alaska from winter, through spring and summer, and back through fall to winter again.
| Next to each month's color scale is an arrow that shows the average temperature across the state for that month. For example, the average temperature in Alaska for January is -1.5°F. The "avg." arrow moves up and down the color scale as the animation continues. |
Note that monthly temperature increases quickly during the spring, especially for the northern part of the state, as sunlight reaches areas that experienced weeks or months of continuous darkness during the winter. Conversely, temperatures decrease rapidly during the fall, especially for the northern areas as they enter the "winter night".
The nothern and eastern parts of the state experience extreme shifts in temperature (from purple to red), whereas the southern fringe along the Gulf of Alaska doesn't vary as much (from green to orange). For example, south of Barrow on Alaska's North Slope, temperature varies from -22°F in January to 55°F in July: a temperature range of 77°F. Compare that with the coast southeast of Anchorage, where temperature varies from 28°F in January to 55°F in July: a temperature range of only 27°F. This is illustrated below for two weather station sites:
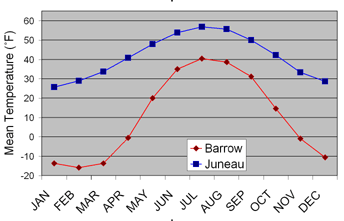 |
The graph at left shows that the village of Barrow, at the northern tip of the state, experiences a large seasonal range in temperature (shown in red). In contrast, temperatures at Juneau, on the southeastern panhandle, vary less through the seasons (as shown in blue). Data from the Alaska Climate Research Center (1971-2000 Normals). |
 |
This spatial variation in seasonal temperature range is due mainly to two factors: the effects of solar radiation as it varies seasonally with latitude; and proximity to the moderating influence of ocean waters, from continental conditions in the interior to maritime conditions near the Pacific Ocean and Bering Sea. (Click on image for larger view). |
The temperature animation next shows a second series of color-coded maps:
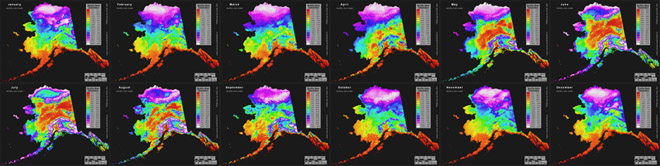
In this series, each month uses a different color scale, customized to that month's range in temperature. Red and orange represent warmer areas for that month, whereas purple and blue show cooler areas for that month. The temperature values in the GIS grids are the same as in the previous series, but the color scales are shown differently to highlight spatial variation.
 |
During winter, temperature across the state shows a strong relationship with latitude -- cold to the north and warm to the south. (Click on image for larger view). |
 |
In contrast, during summer, temperature is strongly controlled by elevation -- cold at the higher reaches of the Alaska and Brooks Ranges, and warmer in the lowlands. (Click on image for larger view). |
This series of maps also shows the importance of coastal effects. These occur during the fall and winter when the ocean is relatively warmer than the land, and in summer when the ocean is relatively cooler than the land:
|
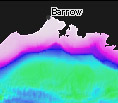
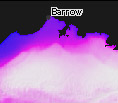
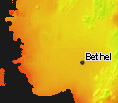
In late fall and winter, the ocean slightly warms the nearby land. For example (at left), the proximity of the Arctic Ocean makes the coast near Barrow (blue) relatively warmer than the inland coastal plain (white). A similar warming effect occurs near Bethel and the Bering Sea (at right). |
|
 July |
In summer, the ocean strongly cools the nearby land. The coast near Barrow (light purple, at left) is cooler than the inland coastal plain (green). A similarly pronounced, cooling effect occurs near Bethel (at right). Coastal effects are strongest during summer, especially along the Arctic coast where sea ice still lingers offshore. |
 July |
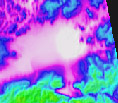
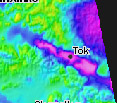
The maps also show the impact of winter inversions, a situation where lowlands and basins in the interior of Alaska are suprisingly colder than nearby uplands or mountain ranges:
|
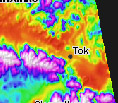
Cold air sinks and collects in the area of the Porcupine Flats (white and light purple, at left), north of Fairbanks. In this case, the lowland basin is actually colder than nearby uplands (blue to green). A similar inversion occurs near Tok (at right). Winter inversions like these are exceptions to the general rule that temperature usually decreases with elevation, from lowland to mountain top. |
|
 July |
These areas go from being nearly the coldest places in Alaska in winter to some of the warmest places in summer. The Porcupine Flats area (at left) reaches an average of 63°F in July due to the effects of continentality in the interior. The Tok area (at right) similarly experiences strong temperature shifts from winter to summer. |
 July |
Play the animation to view environmental parameters that control these and other patterns in space and time for temperature. The animation ends with a map of mean annual temperature.
Alaska Geospatial Climate Animations