The author(s) will give a talk
Quantifying layers of refrozen melt in ice cores using bubble density
1 University of Maine
2 University of Maine
3 University of Maine
4 Dartmouth College
5 University of Maine
6 University of New Hampshire
7 University of Maine
Ice cores provide some of the highest resolution records available of past climate, in particular past temperature, which can be derived through stable isotope concentrations or through melt layers. Melt layers present an especially robust way to reconstruct past temperatures due to the direct physical link between surface temperatures and their production. Despite the robustness of ice core melt layers as a quantitative summer temperature proxy, there are only two melt records contained in the PAGES2K database, and a handful of others that have been published, mostly restricted to the eastern Arctic. The one published melt record used for paleoclimatic interpretation in the North Pacific region (Winski et al. 2018) is from Mt. Hunter (Alaska Range) and spans the last 400 years. The Hunter core extends throughout the Holocene (basal 14C date of >8 kyr), with an annual layer chronology to 800 CE. Preliminary observations suggest intense melt production during the Medieval Climate Anomaly (MCA); however, melt features at this depth have not been quantified because of uncertainties related to vertical thinning, possible flow-related effects, and challenges in identifying melt layers after they have undergone a high degree of strain. We use bubble density to quantitatively distinguish refrozen melt from unaltered ice at depth in the Hunter core. Bubble density is lower in melt layers than in the surrounding ice; however, numerically quantifying bubble density has not been applied as a melt identification method.
To quantify bubble density in the Hunter core, we cut twenty-nine thin sections lengthwise (3-7 cm each) ranging from 100 to 200 m in depth (approximately 1950 back to 350 CE): 8 for control segments (unaltered ice), 3 for segments containing melt layers identified using established techniques, and 18 for segments containing ambiguous features. Thin sections were photographed with and without crossed polarized lenses, at varying brightness levels and polarizer angles. Bubbles were digitized as black ellipses in the two best polarized photos, and in the unpolarized photo taken at highest bulb brightness, resulting in three bubble maps for each thin section. The average pixel brightness within each column of pixels in each map was calculated as a measure of the bubble fraction of that pixel column. Pixel columns were then converted to depth in core using sample top and bottom depths. Lastly, the bubble fraction data from both polarized maps were combined to mitigate any error arising from differences in bubble contrast among grains due to birefringence, resulting in two final bubble fraction datasets for each sample. Melt layers identified using established techniques, as well as some ambiguous melt features do appear in the bubble fraction data; however, their boundaries are poorly constrained, so calculating the amount of melt contained in these layers is not yet possible. Results validate established visual identification techniques with numerical quantification of bubble density (Fig. 1). Additionally, results are consistent with the existence of melt layers at depth (including during the MCA), suggesting that modern warming is not outside of the range of expected variability for this region. Further work to constrain the boundaries of melt layers at depth is necessary to derive temperatures from this preliminary melt record, and we will discuss our ideas to address this issue. However, this study is an important first step in filling a marked gap in the spatial distribution of available ice core melt records.
Winski, D., Osterberg, E., Kreutz, K., Wake, C., Ferris, D., Campbell, S., Baum, Bailey, A., Birkel, S., Introne, D., Handley, M., 2018, A 400-Year Ice Core Melt Layer Record of Summertime Warming in the Alaska Range: Journal of Geophysical Research, v. 123, p. 3594-3611.
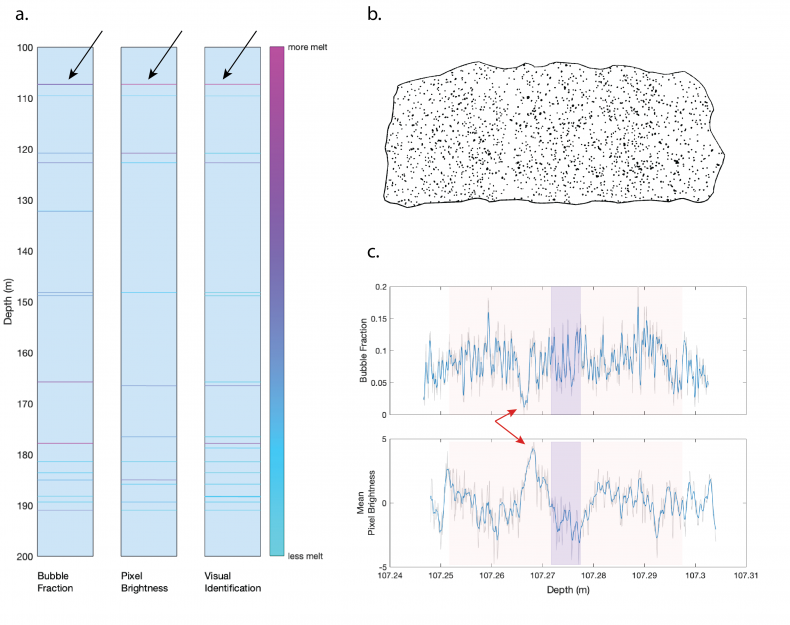
Fig 1.
Relative magnitude of melt layers at 100-200 m depth from three analytical techniques (a), digitized bubble map of thin section 115a (b), and bubble fraction and detrended mean pixel brightness along thin section 115a (c). Melt layers in panel (a) are quantified based on bubble fraction, pixel brightness, and visual identification in full core photos. The location of thin section 115a (shown in panels (b) and (c)) is indicated by black arrows on core diagrams in panel (a). Red arrows indicate melt layer position identified in thin sections. Transparent Purple bars indicate depth of optically identified melt layer in full core photographs. Transparent red shading indicates uncertainty in melt layer depth in thin section arising from error introduced during thin section production. Melt layers identified in thin section are offset, but within error, from those identified in full core photographs.