The author(s) will give a talk
Annually resolved past climate changes from South Sawtooth Lake 2900-year-long varved record
1 Institut national de la recherche scientifique, Centre Eau Terre Environnement, Québec, Canada
2 University of Massachusetts Amherst, Department of geosciences, Amherst, MA, USA
3 University of Massachusetts Amherst, Department of geosciences, Amherst, MA, USA
4 University of Pittsburgh, Geology and Planetary Science, Pittsburgh, PA, USA
Few annually laminated (varved) lacustrine records exist in the Arctic and elsewhere (Zolitschka et al. 2015). These sedimentary sequences are excellent high-resolution climate archives because they are continuous, undisturbed, and contain their own annually resolved chronology (Zolitschka et al. 2015). Therefore, they can inform about abrupt changes and high frequency climate variability. Over the last 25 years, we have investigated the exceptional South Sawtooth Lake (SSL) 2900-year-long varved record located on Fosheim Peninsula, Ellesmere Island.
Watershed and lake processes monitoring, as well as many short and long cores obtained in several places in the lake basin over the years allowed to understand how these sediments are deposited and to establish the main climate factors driving the sedimentation (Francus et al. 2008). A single tributary from a currently not glacierized watershed feeds the lake that consists in a proximal and distal basin separated by a sill. Finely laminated sediments are only deposited in the distal basin and are mainly formed by the settling of overflows and interflows.
The annual nature of these laminations is confirmed by multiple cores retrieved over 25 years, as well as by 137Cs and 210Pb dating. About 100 thin-sections covering the entire composite sequence were made and examined at the SEM. About 8000 high-resolution backscattered images were used to precisely delineate varves and to obtain grain size for each year of sedimentation. The 5.25-meter long record was also analyzed using a medical CT-Scanner and Itrax Core scanner with a 100 microns resolution, for paleomagnetic variations, and optically stimulated luminescence dating.
The properties of each varve from the uppermost core section was compared to a set of instrumental data (on-site meteorological data, linked to hydrological monitoring, and the closest Meteorological Service of Canada station at Eureka). Coarse grain size, reflected in PC1 of a Principal Component Analysis, is significantly and positively correlated with May to August temperature from 2011 to AD 1948. PC1 also displays a significant correlation (r = 0.65, p < 0.001) over the last 2900 years with the nearby Agassiz Ice Cap δ18O record, including lower values during the Little Ice Age cold period (Lapointe et al. 2019) (Fig 1).
PC2 is indicative of Ti and finer particle size (% < 20 mm). Colder conditions preserve snow in the area, and tend to favour fine to medium silt deposition in the lake and represents nival melt (Francus et al. 2002). Ti and PC2 show a negative correlation to instrumental temperature (r = 0.49, p < 0.001) at Eureka. SSL record was also compared to major natural climate oscillations (Fig. 2A and 2B). We found that Ti was correlated (r = 0.57, P < 0.0001) to instrumental Atlantic Multidecadal Variability (AMV) (Enfield et al. 2001) (Fig. 2C). The maximum Ti concentration coincides with the coldest SSTs in the North Atlantic from 1900–1925 CE, while lowest Ti values were found when SSTs were warmest, after 2005 CE.
We used this relationship to project past AMV changes over the last 2900 years (Fig. 3A). Amongst several significant correlation, the strongest was found with DYE-3 δ18O record from southern Greenland (Vinther et al. 2009), 2,000 km SE of SSL (Fig. 3B). The overall strong covariability between the AMVSSL and this ice core archive shows that southern Greenland and the Canadian High Arctic shared a common climate pattern over the past 3 millennia, driven by Atlantic SSTs.
Enfield, D., Mestas-Nunez. M., Trimble. P., 2001, The Atlantic multidecadal oscillation and its relation to rainfall and river flows in the continental U.S. Geophys. Res. Lett. 28, p. 2077–2080.
Francus, P., Bradley, R.S., Abbott, M.B., Patridge, W., Keimig, F., 2002. Paleoclimate studies of minerogenic sediments using annually resolved textural parameters. Geophys. Res. Lett. 29, 20, p. 5951-5954.
Francus, P., Bradley, R.S., Lewis, T., Abbott, M., Retelle, M., Stoner, J.S., 2008, Limnological and sedimentary processes at Sawtooth Lake, Canadian High Arctic, and their influence on varve formation. J Paleolimnol 40, 3, p. 963-985.
Lapointe, F., Bradley, R.S., Francus, P., Balascio, N.L., Abbott, M.B., Stoner, J.S., St-Onge, G., De Coninck, A., Labarre, T., 2020, Annually resolved Atlantic sea surface temperature variability over the past 2,900 y. Proc Natl Acad Sci U S A 117, 44, p. 27171-27178.
Lapointe, F., Francus, P., Stoner, J.S., Abbott, M.B., Balascio, N.L., Cook, T.L., Bradley, R.S., Forman, S.L., Besonen, M., St-Onge, G., 2019, Chronology and sedimentology of a new 2.9 ka annually laminated record from South Sawtooth Lake, Ellesmere Island. Quatern Sci Rev 222. p.
Vinther, B. et al. 2009, Holocene thinning of the Greenland ice sheet. Nature 461, p. 385–388.
Zolitschka, B., Francus, P., Ojala, A.E.K., Schimmelmann, A., 2015, Varves in lake sediments – a review. Quat Sci Rev 117, p. 1-41.
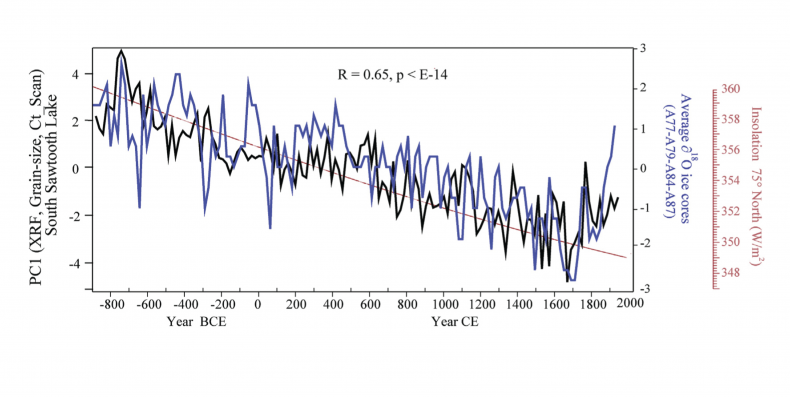
Fig 1.
Comparison between South Sawtooth Lake PC1 (micro-XRF, HU, maxDo, D50 and D99) with Agassiz δ18O (mean of A77-A79-A84-A89 ice cores; Fisher et al., 1995).
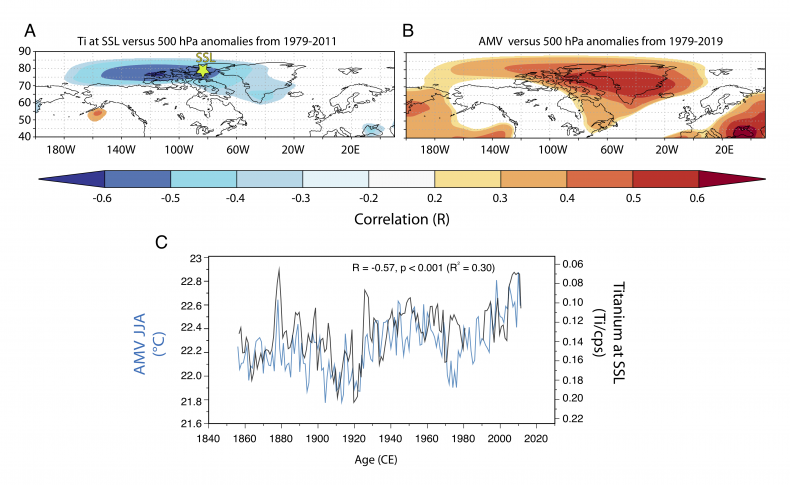
Fig 2.
Ti variability at SSL and its relationship with instrumental AMV. (A) Map correlation between Ti variability and atmospheric pressure at 500 hPa from ERA-Interim during summer (JJA) from 1979 to 2011. (B) Same as A but for the instrumental AMV during summer (JJA) from 1979 to 2019 (Enfield et al. 2001). (C) Comparison between Ti at SSL (inverted values) and the instrumental summer (JJA) AMV over the instrumental period 1856–2011. Yellow star (A) denotes the location of SSL record. (modified from Lapointe et al. 2020).
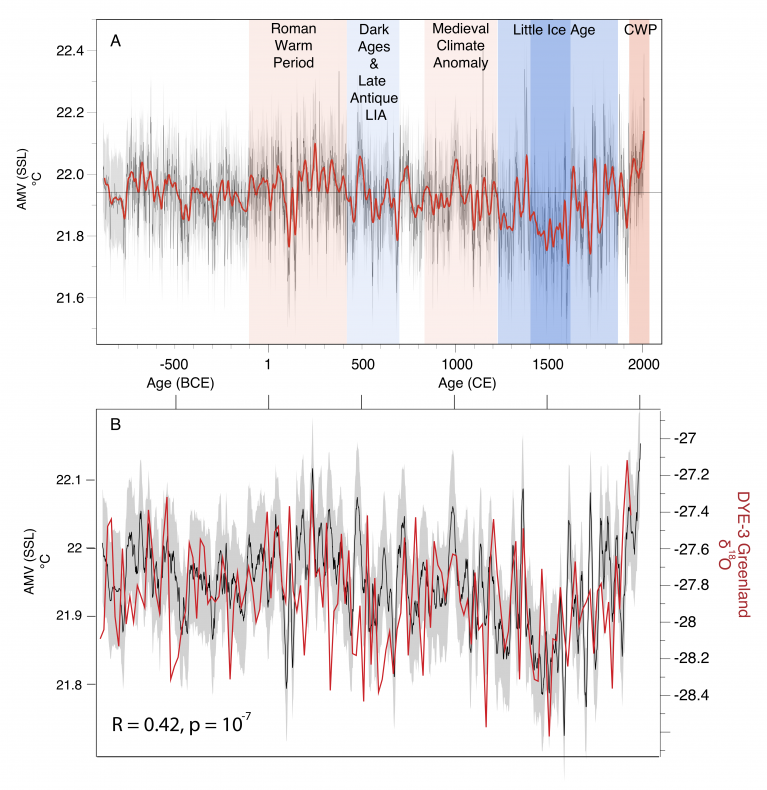
Fig 3.
(A) Annual AMV changes over the past 2,900 years with a 30-y loess first- order low-pass filter (red). The gray horizontal line is the estimated average SST over the past 2,900 years (22.19°C). CWP denotes Current Warm Period. Shaded gray regions represent the 95% confidence intervals on the annual reconstructed AMVSSL, based on uncertainty estimates. (B) Comparison between DYE-3 Greenland δ18O record and the AMVSSL (modified from Lapointe et al. 2020).