|
|
 University of Colorado at Boulder |
Except for the Google Earth Global Viewer this page gives examples of the mappings
and other data displays that have been produced for various projects. For the actual data please contact the project team.
and other data displays that have been produced for various projects. For the actual data please contact the project team.
| Google Earth Global Viewer A browser for the data in dbSEABED, presented in 0.1 degree bins. The display web page, LINK HERE, allows users to download or start a KML file which integrates data tiles for the world for viewing. In Google Earth (or other fully compatible applications) zoom down to about 1000km altitude, till when white bin outlines appear. Then click on any of the cells to discover what sediment / rock / biologic remains have been observed there. These data are not intended for bulk download, for discovery only. Graphic: The 0.1 dg grid of sediment textures offshore of the Amazon River. The muds (green colour code) tend to move northward out of the delta area. (Dated Nov 2019 - new version 0.3) |  |
| Global
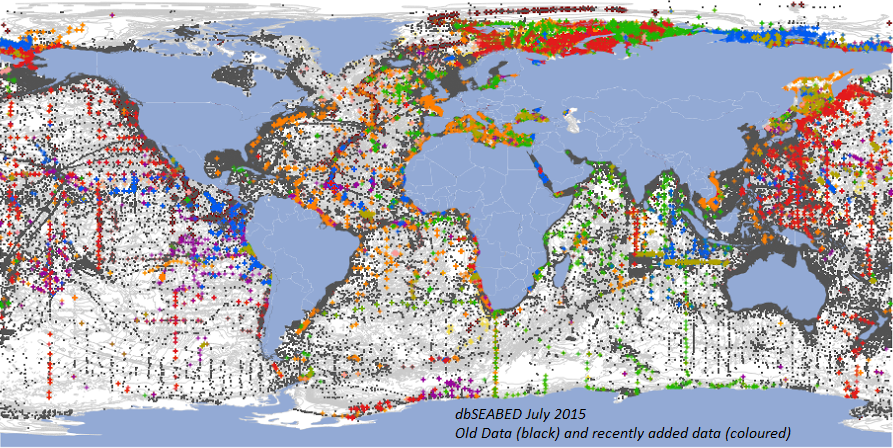
Data Distribution dbSEABED holds data characterizing the seabed at about 5 million samplings, at 3 million geographic sites. It is clearly the largest integration of data on the global seafloor substrates. But the fractional coverage of the ocean floor is still less than needed, because of the vastness of the ocean. Efforts continue in the project to find and activate datasets to increase the fractional coverage. Progress is rapid. In 2 months (mid 2015) another 60,000 data sites have been added from Russian, Norwegian, Australian and other sources. Presently, at 0.1dg cellwise resolution, the active data in dbSEABED characterize 29% of the seabed (1254305 cells of 4337130). The median distance from any position in the ocean to a site with data is ~54km. The greatest distance is 600km. It is often said that we know about only 5% of the ocean: 5% of the ocean area lies within ~6km of dbSEABED data. For more statistics see these SpatialStatistics plots. Graphic: Worldwide distribution of the data, showing recent additions (Dated 2015; colours represent individual datasets) (click to enlarge) |
 |
| Hurricane Seabed Sediment Pickup: Gulf of Mexico Time Series For a project with BOEM, VIMS, UCSB and ROMS at RutgersU, hurricane wave data from ROMS was convolved with seabed data from dbSEABED and bathymetry from SRTM30+. Sediment suspension ('pickup') under the oscillating bottom currents from sea-surface waves that attained 8m height and 90m wavelength in storms 'Gustav' and 'Ike' 2008, was modelled using erosion relations from Parchure and Mehta (1985) and Nielsen (1992) for the muddy and sandy environments, and also decremented the results for areas of rock, gravel that are shown by dbSEABED. The results are therefore spatially and temporally explicit. This can be seen for the muddy facies around the delta. The analysis went on to apply sediment diffusion models (1D) and predict the Richardson and Reynolds numbers for the suspended sediment layers, and finally the criterea for flow instabilities leading to gravity flows in sloping areas. Deeper levels of the seafloor are less affected by the waves. Graphic: Time-series movie-mapping of the ppm volume suspended sediment concentrations, near-seafloor, created by flows from the sea-surface waves during hurricanes Gustav and Ike, 2008. This single image shows activity near storm-peak. The depth contours are 25,50,100,250, 500, 1000 and 2000 m WD. (Dated Aug 2017) (click to rum) |  Click for Gif Movie |
| Bering
Sea Under project work for future regulation of global deep-sea trawling, methods for map-interpolation of seabed characteristics have been extended. For statistical correctness, the mapping and analysis is done in equal-area projections, giving unbiased results over the latitude gradients of large areas. A fusion of Inverse Distance Weighted interpolation and Random Forest classification solves the problem of local versus regional map gridding for large areas having varying data densities. The IDW process allows proper mapping of actual local, perhaps unexpected materials. The RF process fills in areas far from actual data, with the regionally expectable results. The IDW method is a modified one, appropriate for the coastal zonation, directional biases in the data, and water depth variations. Full estimation of the map uncertainties is also carried out. Graphics: The Bering Sea is an extremely important economic area for the USA in its fisheries, and these mappings will help plan for economic sustainability. The figure shows Folk seafloor sediment texture codes for the region based on the combined IDW-RF mapping, computed and rendered in Alaska Albers Equal Area Projection. Click HERE for legend and HERE for the corresponding uncertainty mapping. The mapping depicts the zonation and patchiness of the seabed conditions. The IDW method rendered features like the Yukon prodelta correctly, which the RF method did not reproduce. The sandy spots marked on the abyssal plain are probably from scattered ice-rafted materials, or turbidites. Similar mappings have been made for many areas of the globe, and can be computed to specification for areas with sufficient data. |
 |
| Global Carbonate To interface with whole-earth scale models, such as climate and circulation models, ocean substrates data has been synthesized from dbSEABED at the global scale. The resolution however, is low (best, 0.1 degrees) - as for most of the models. A parameter of high interest is the carbonate content of the bottom. However, a global synthesis of any main dbSEABED parameter or component/feature is now possible (see lists HERE). The carbonate synthesis follows early work by Archer (1996, "An atlas of the distribution of calcium carbonate in sediments of the deep sea." Global Biogeochemical Cycles 10, 159-174), but has a number of changes: (i) the amount of data available is much greater; (ii) the core-top criterion is relaxed (based on arguments involving bioturbation, erosion, managment of core overpenetrations in underlying database); (iii) rock areas bare of sediment (such as the spreading ridges) and Fe-Mn nodule areas are accounted for; (iv) shallow-water areas - which also play a role in ocean carbonate chemistry (see Andersson, AJ & Mackenzie FT. 2012. "Revisiting four scientific debates in ocean acidification research", Biogeosciences. 9, 893-905) are mapped. Prime amongst the shallow water areas is the "Coral Triangle" area of SE-Asia, Indonesia. Some geographic data on the regional distributions of skeletal carbonate types and mineralogies are also available from the project. The mapping suggests lower carbonate contents overall than mapped in earlier works. This may affect modeled budgets for earth-system carbon dioxide and outcomes for ocean acidification. The synthesised data are rapidly being extended, and can be generated on request from the latest version of the full dbSEABED data holdings. Graphic: Global-scale carbonate contents, interpolated using Radial Basis Function methods. Deep blue to dark red, 0 to 100%. (Dated Aug 2014) |
 |
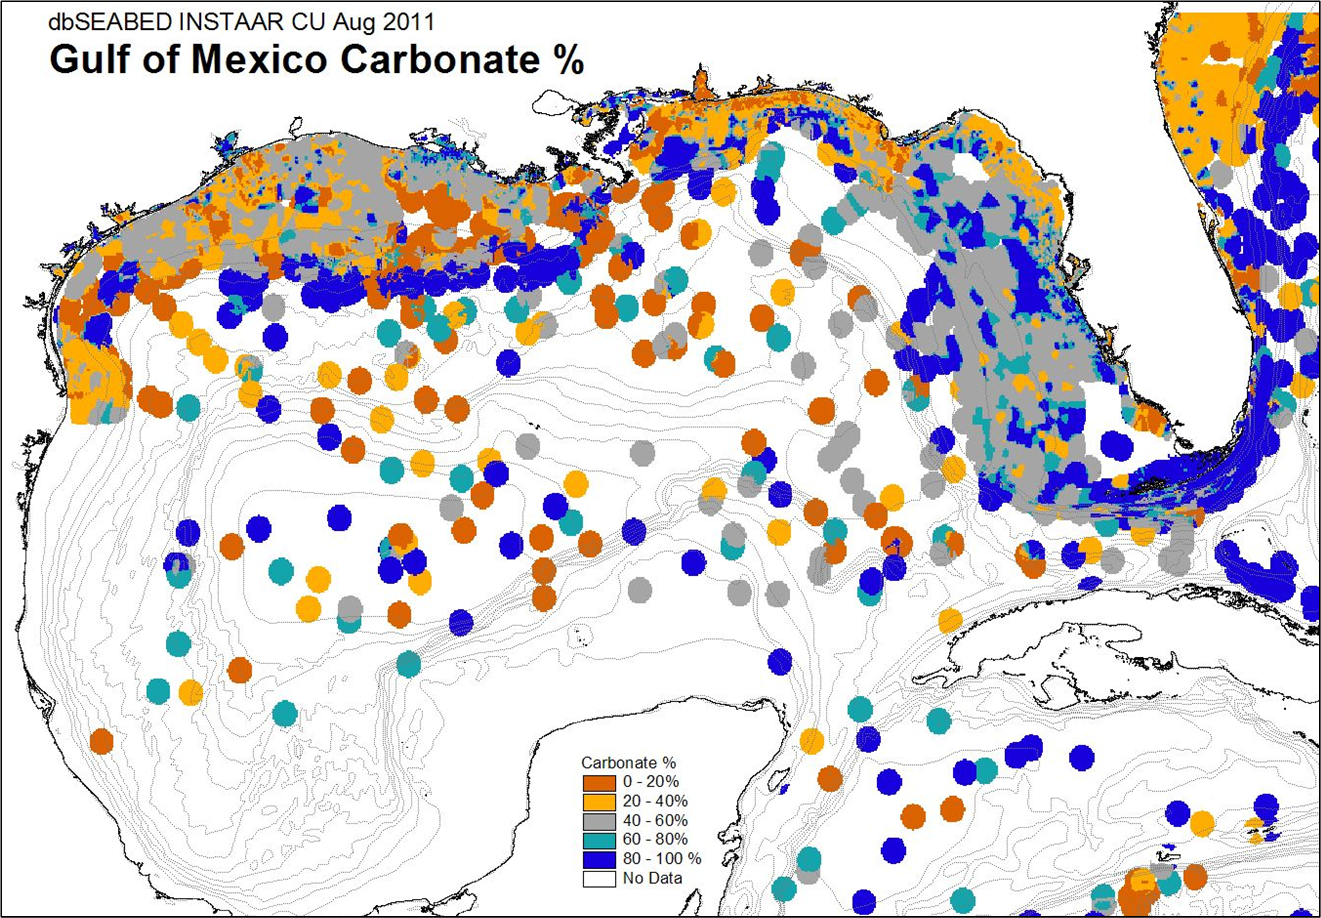
| Gulf of Mexico This region is extraordinarily rich in data and provides a strong test of system capabilities for data ingestion, integration and visualization. Coverages from the system have assisted with shrimp and fish stocks protection, numerical modeling of unstable sediment slopes, and naval object burial potential. Comprehensive gridded data is available from "http://csdms.colorado.edu/wiki/DBSEABED#Northern_Gulf_of_Mexico". (2010; contact INSTAAR for more recent comprehensive coverage.) Habitat-related data layers may be obtained from NOAA NCDDC "Gulf of Mexico Data Atlas" (2011). Graphic: Seafloor carbonate contents in the sediments and crusts. (2011) (click to enlarge) |
 |
| North
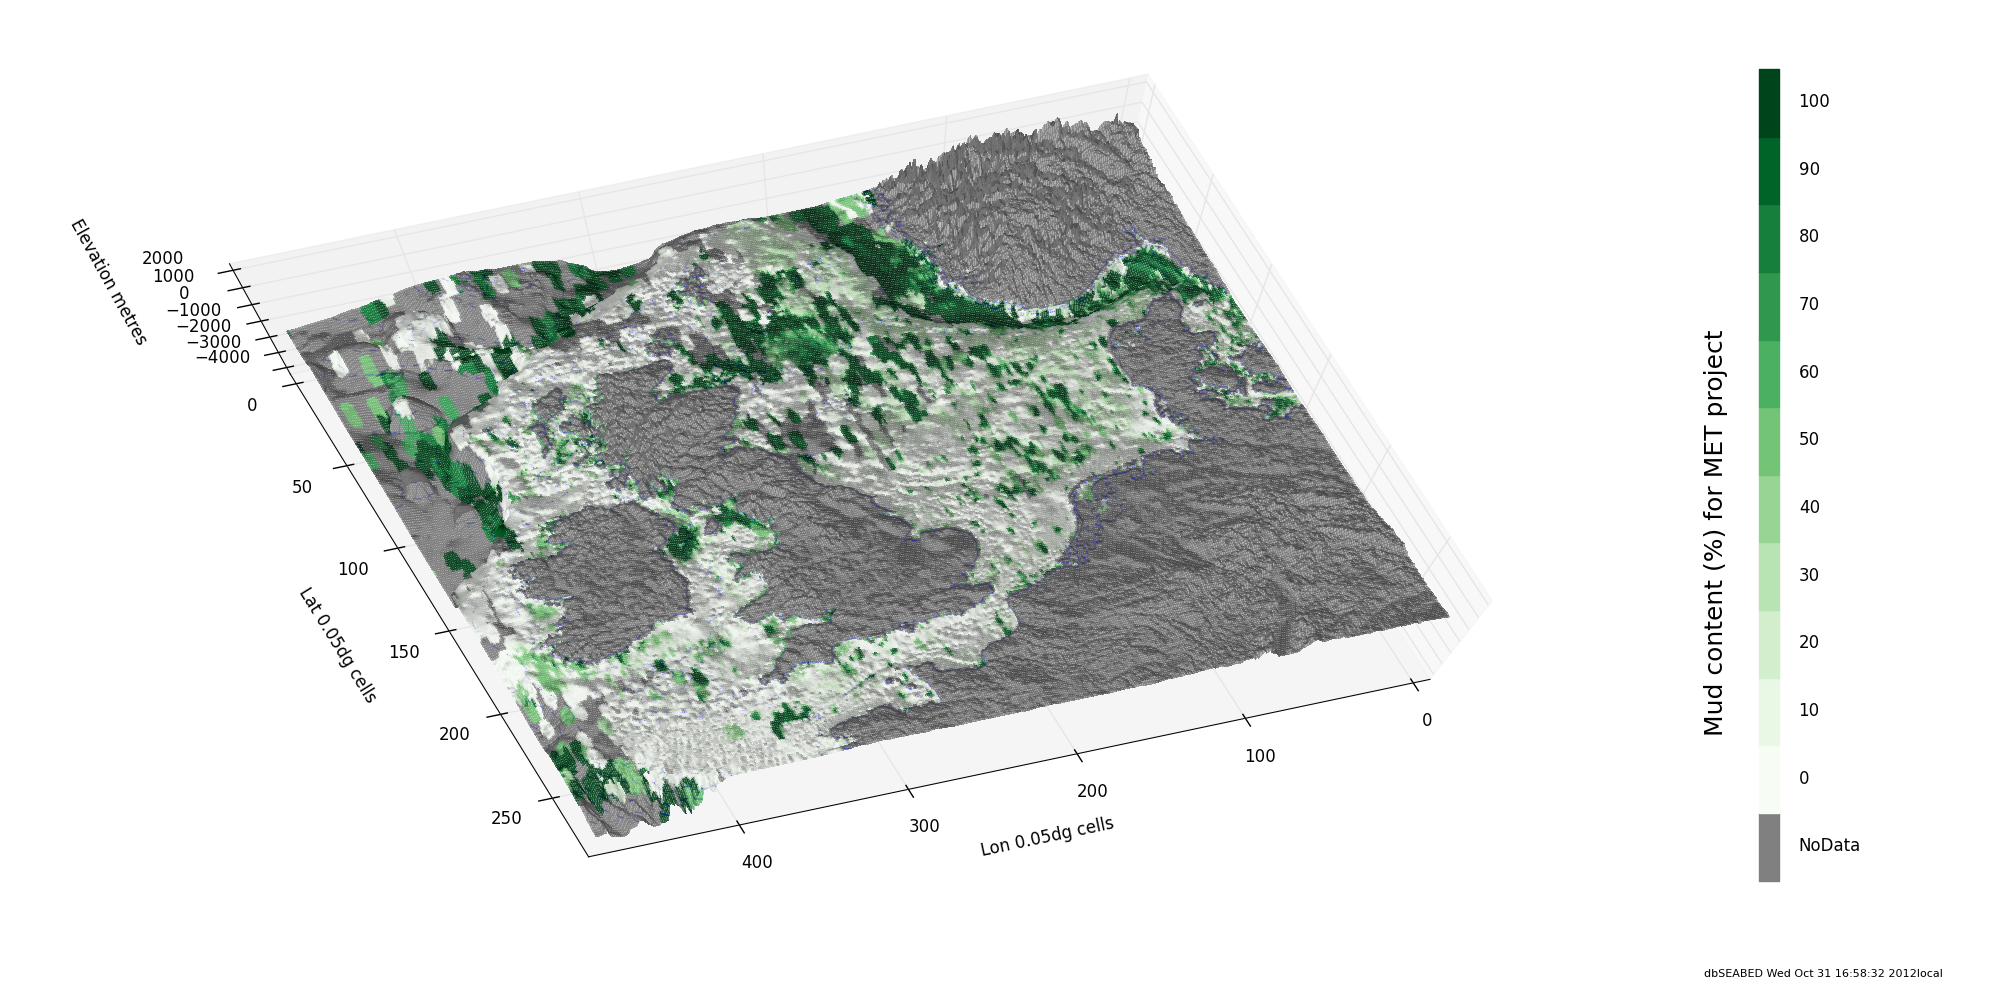
Sea This region is a significant one for research into mapping and modeling. The amount of data available is huge, but there are significant conflicts between the many mapping syntheses that have been released over time. This compilation is a consensus built primarily from public point data, but also employing published grid/polygon maps. The comprehensive gridded and pointwise data are available on request. The work was prompted by an investigation of spatial variabilities for seabed mesoscale roughness and drag relevant to tidal modelling (see bibliography). Graphic: Sediment mud contents (%) in a 3-D visualization of the seafloor of the North Sea and surrounds. (Dated: 2012) (click to enlarge) |
 |
| 100My of Ocean Carbonates in Paleocoordinates dbSEABED can be used for large-scale data analysis. Here a sedimentological attribute (carbonate) of the DSDP, ODP, IODP and many other deep-time samples is plotted in Paleocoordinates through 100My. This allows the actual core data to be viewed in terms of true paleo-latitudes and longitudes - that is, exactly by paleogeography and paleoceanography. (Top, bottom panels are Continent-Ocean Boundaries at present and 100Ma ago. The tracklines show the plate tectonic paths represented by individual cores. The color of points represent the percentages of carbonate at each paleolatitude, paleolongitude, and age. Composed in Summer 2014 for the Deep Carbon Observatory project and ESIP (poster). We acknowledge the contribution of the GPlates facility, thanks.) |
 |
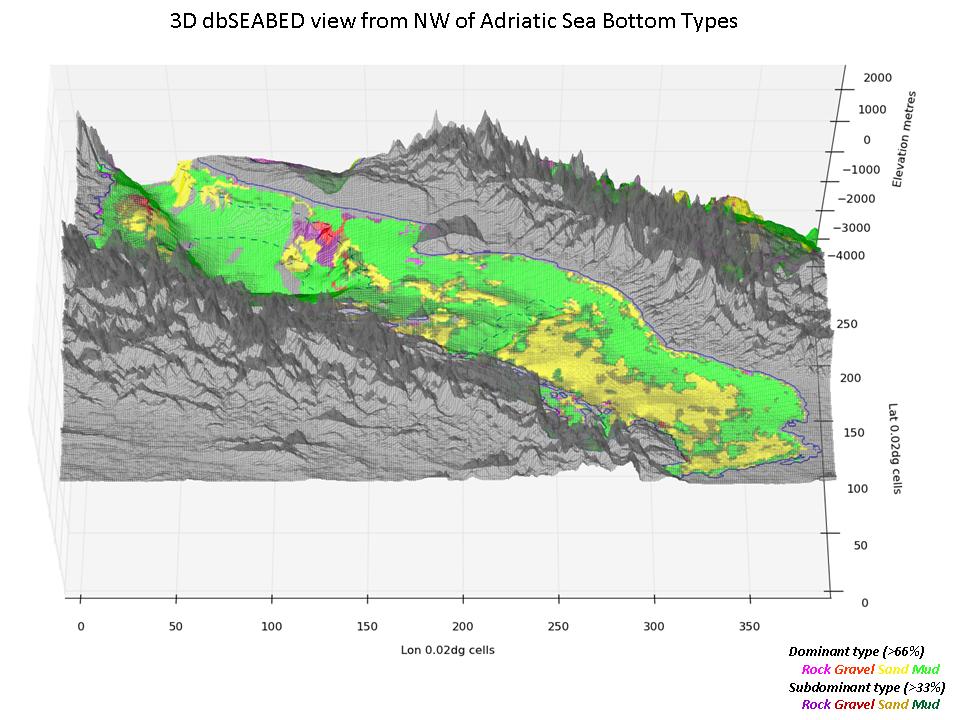
| Adriatic
Sea The Adriatic Sea has been an area for benchmarking numerical models for sedimentation processes. dbSEABED coverages have helped some modeling projects and also studies of ecology. Comprehensive gridded data available from "...dbseabed/coverage/adriaticsea/adriatico.htm". (Contact INSTAAR for more recent, more comprehensive coverages.) Graphic: Bottom-type dominances in a 3-D visualization of the seafloor of the Adriatic Sea. (Dated: 2011) (click to enlarge) |
 |
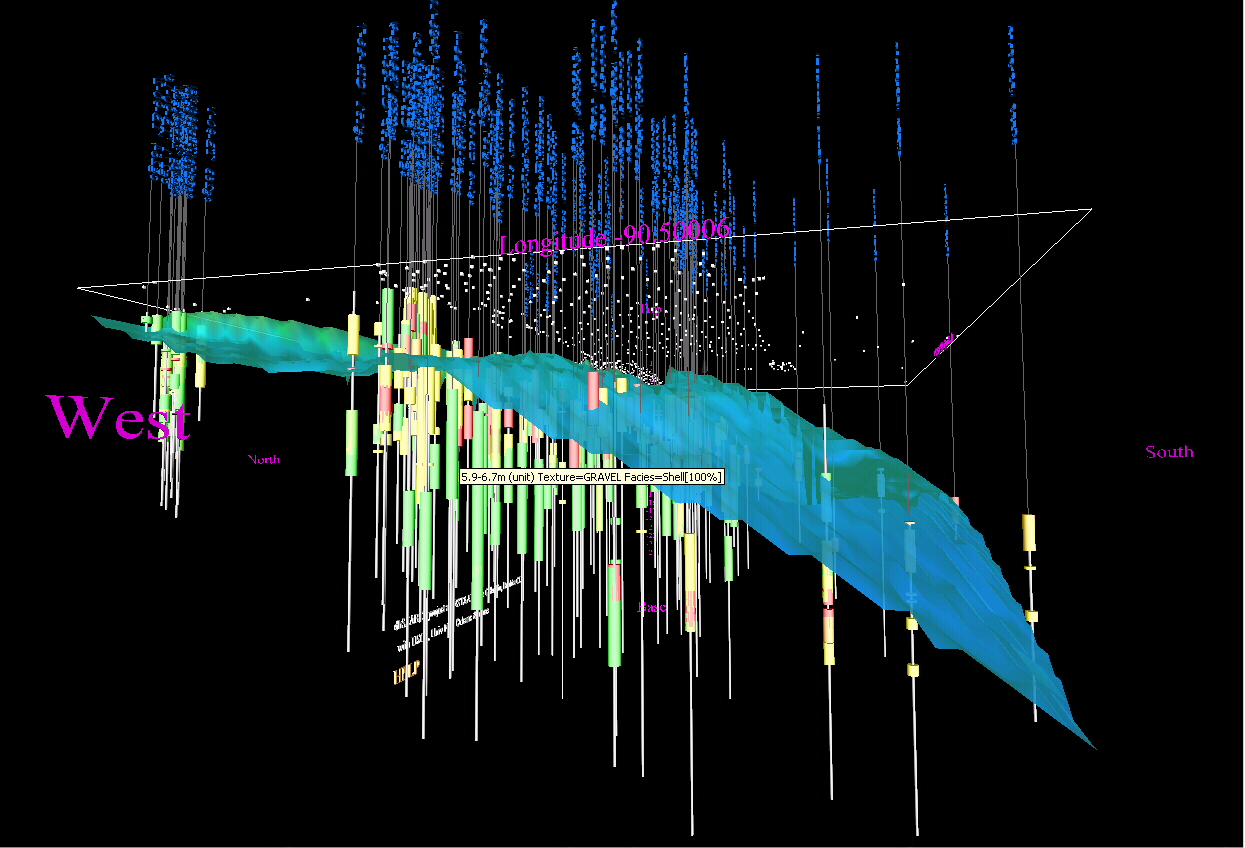
| Louisiana Ship Shoal (3D
Visualization) This area, WSW of the Mississippi Delta was used a the development dataset for Core Navigator. Depiction of 3D stratigraphic data is a complex matter and necessarily, involves a suite of files. Therefore the data are presented as a zipfile collection. There is also a Google-Earth variation of CoreNavigator. Other areas where 3D CoreNavigator structures have been built include the German Bight, offshore slope of the Mississippi Delta and various ODP sites. Graphic: The core collections of the USGS and UNO through Ship Shoal, Louisiana. (Dated: 2008) (click to enlarge) |
 |