2019
|
2/9/19 Gold Lake -
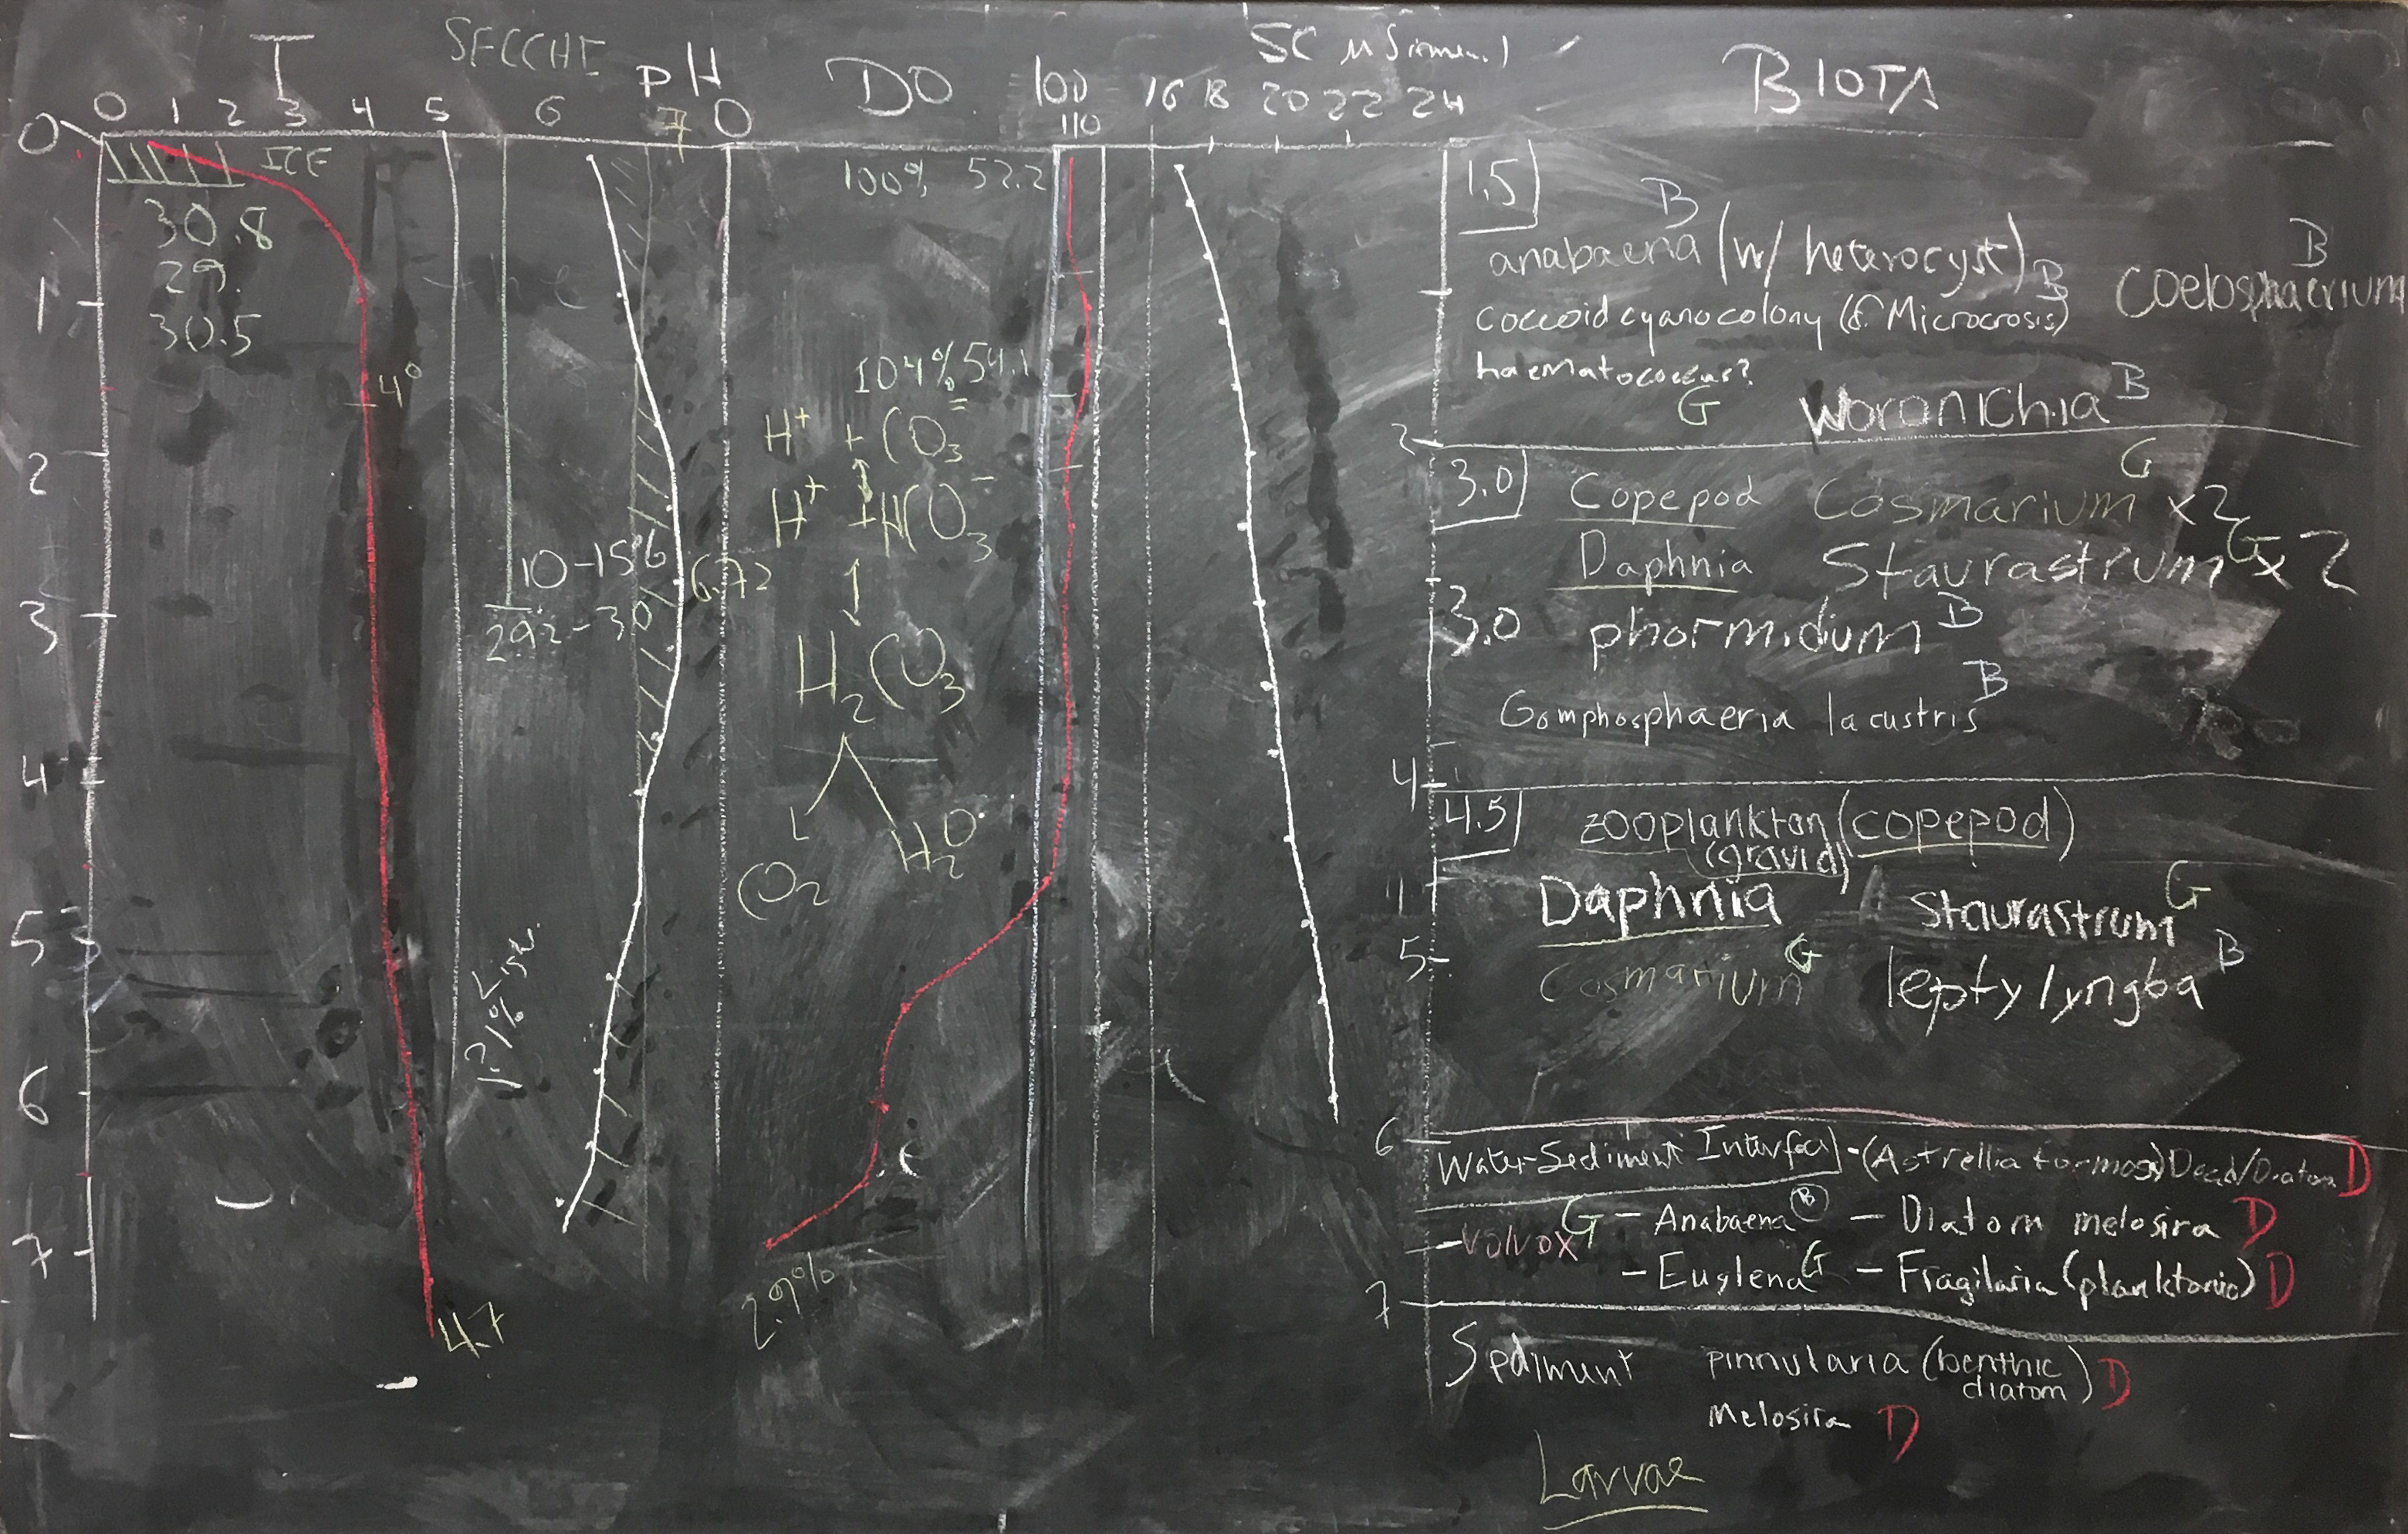
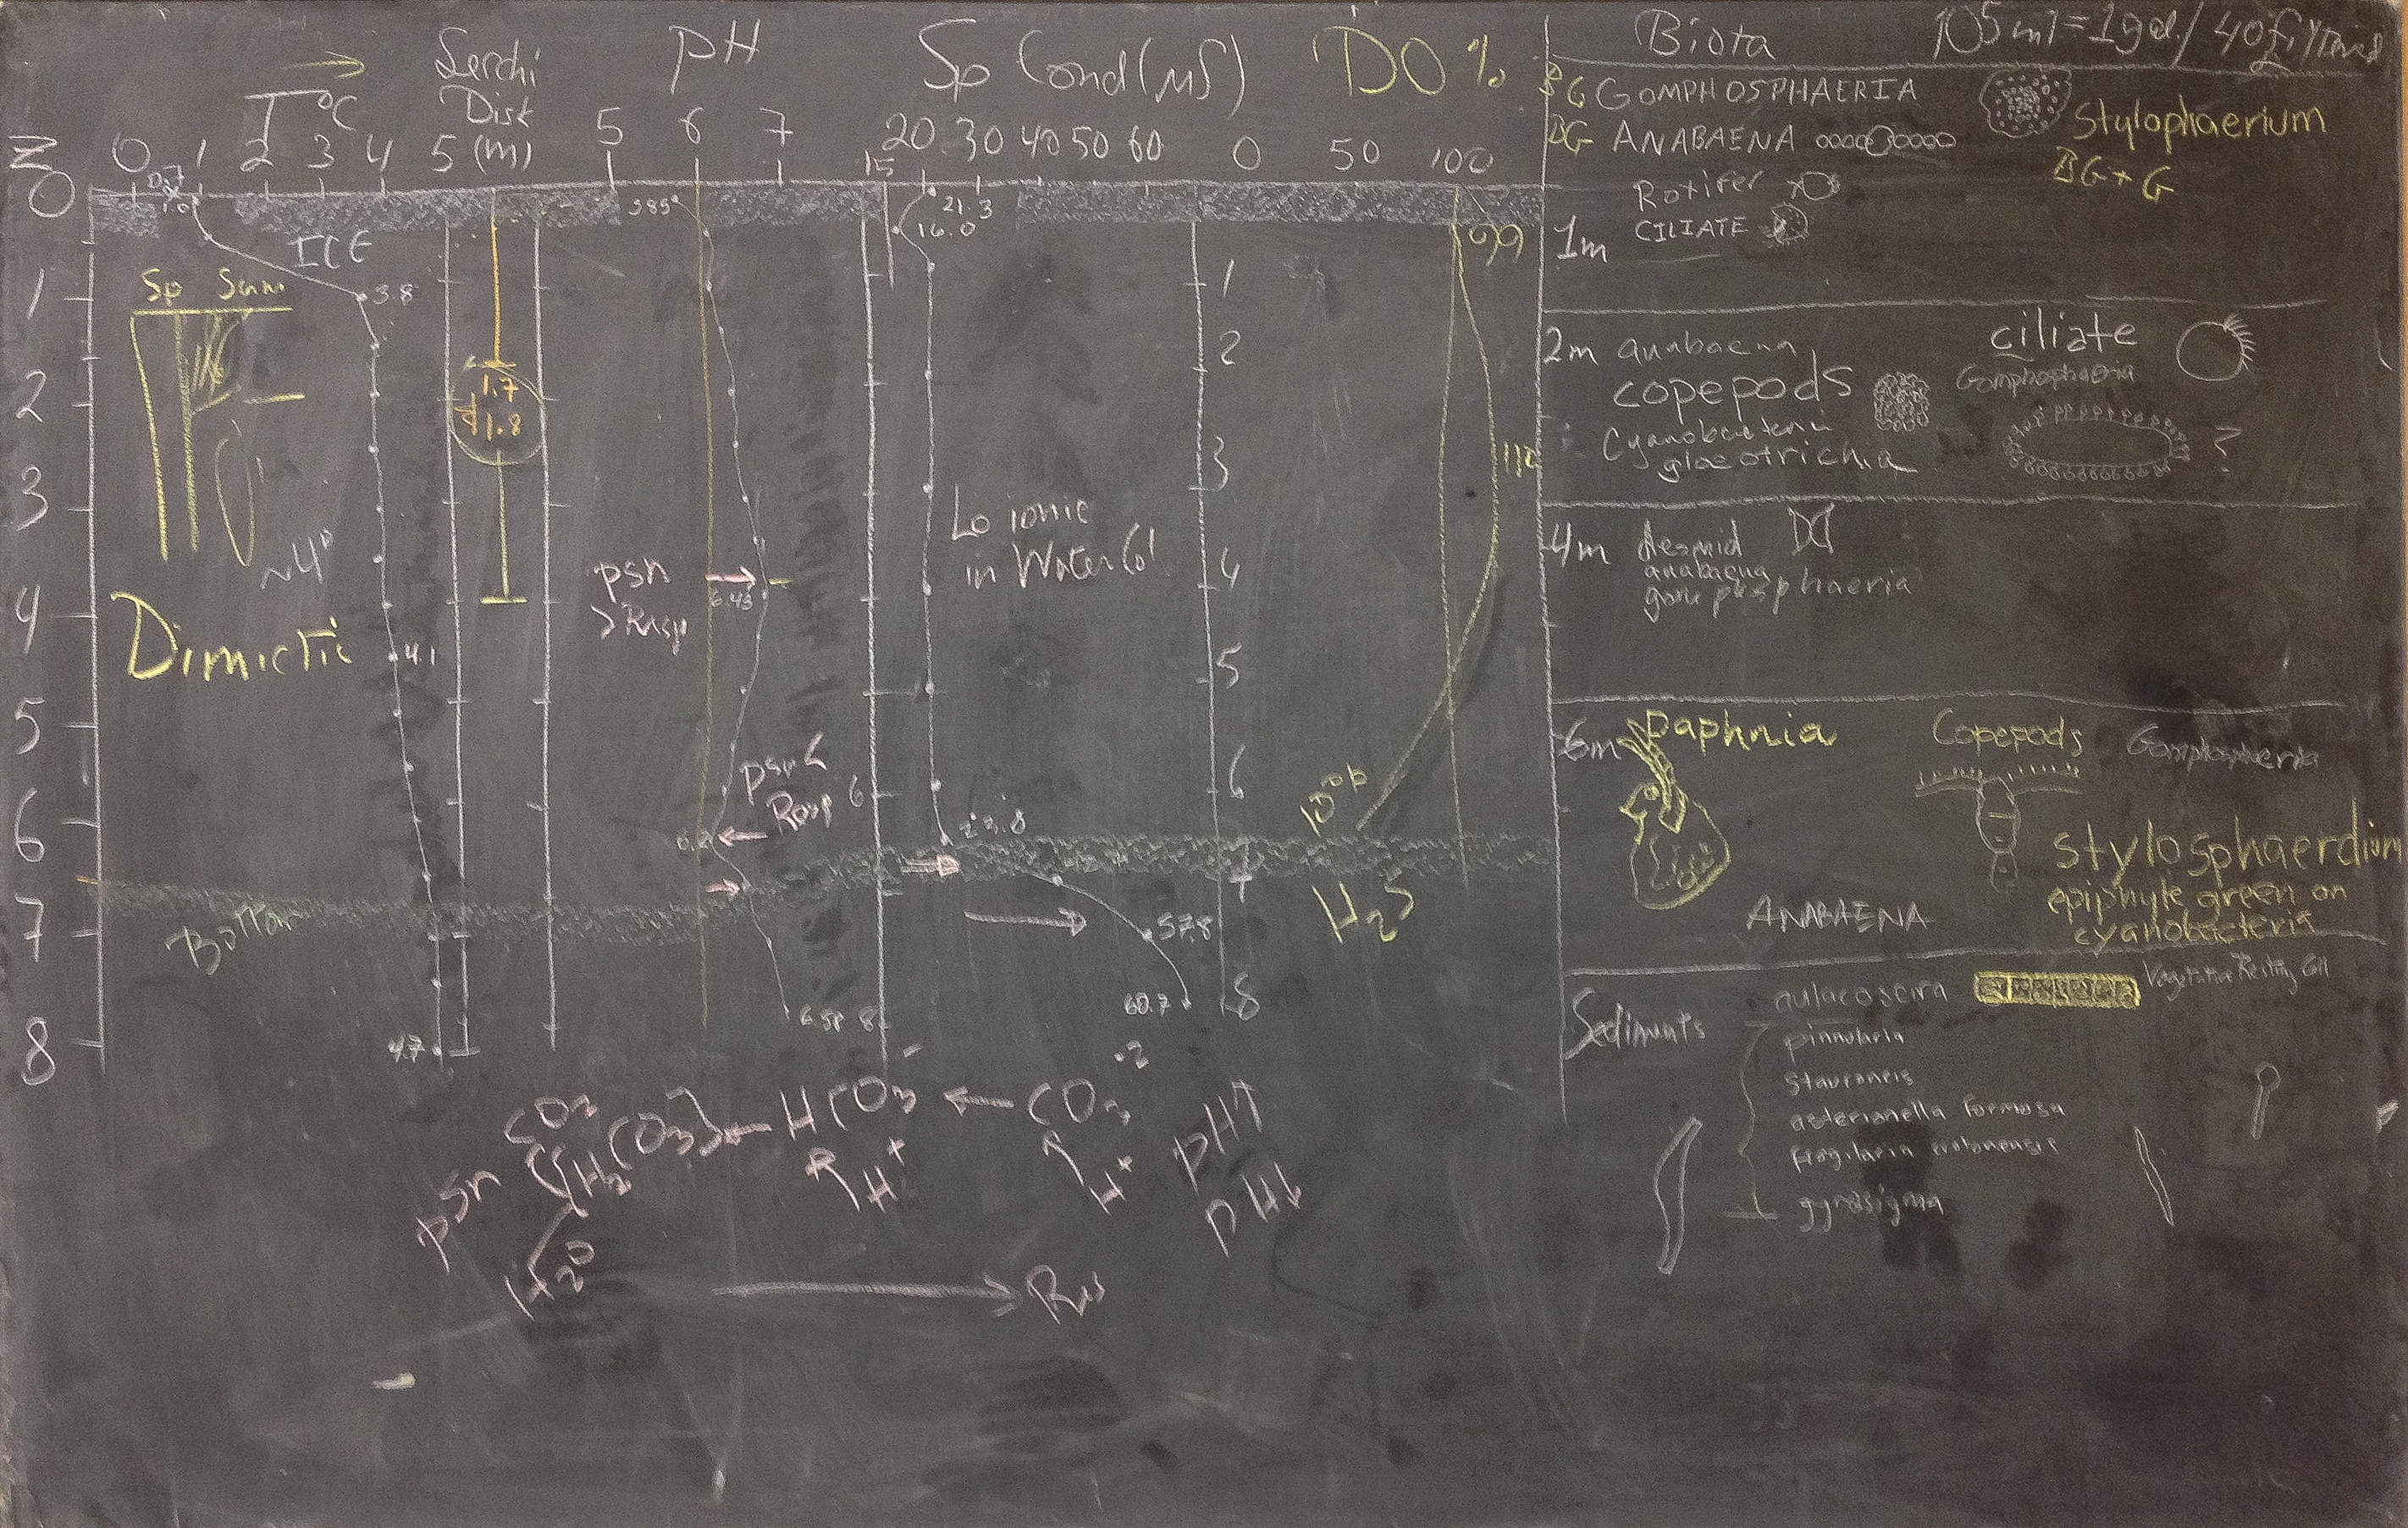
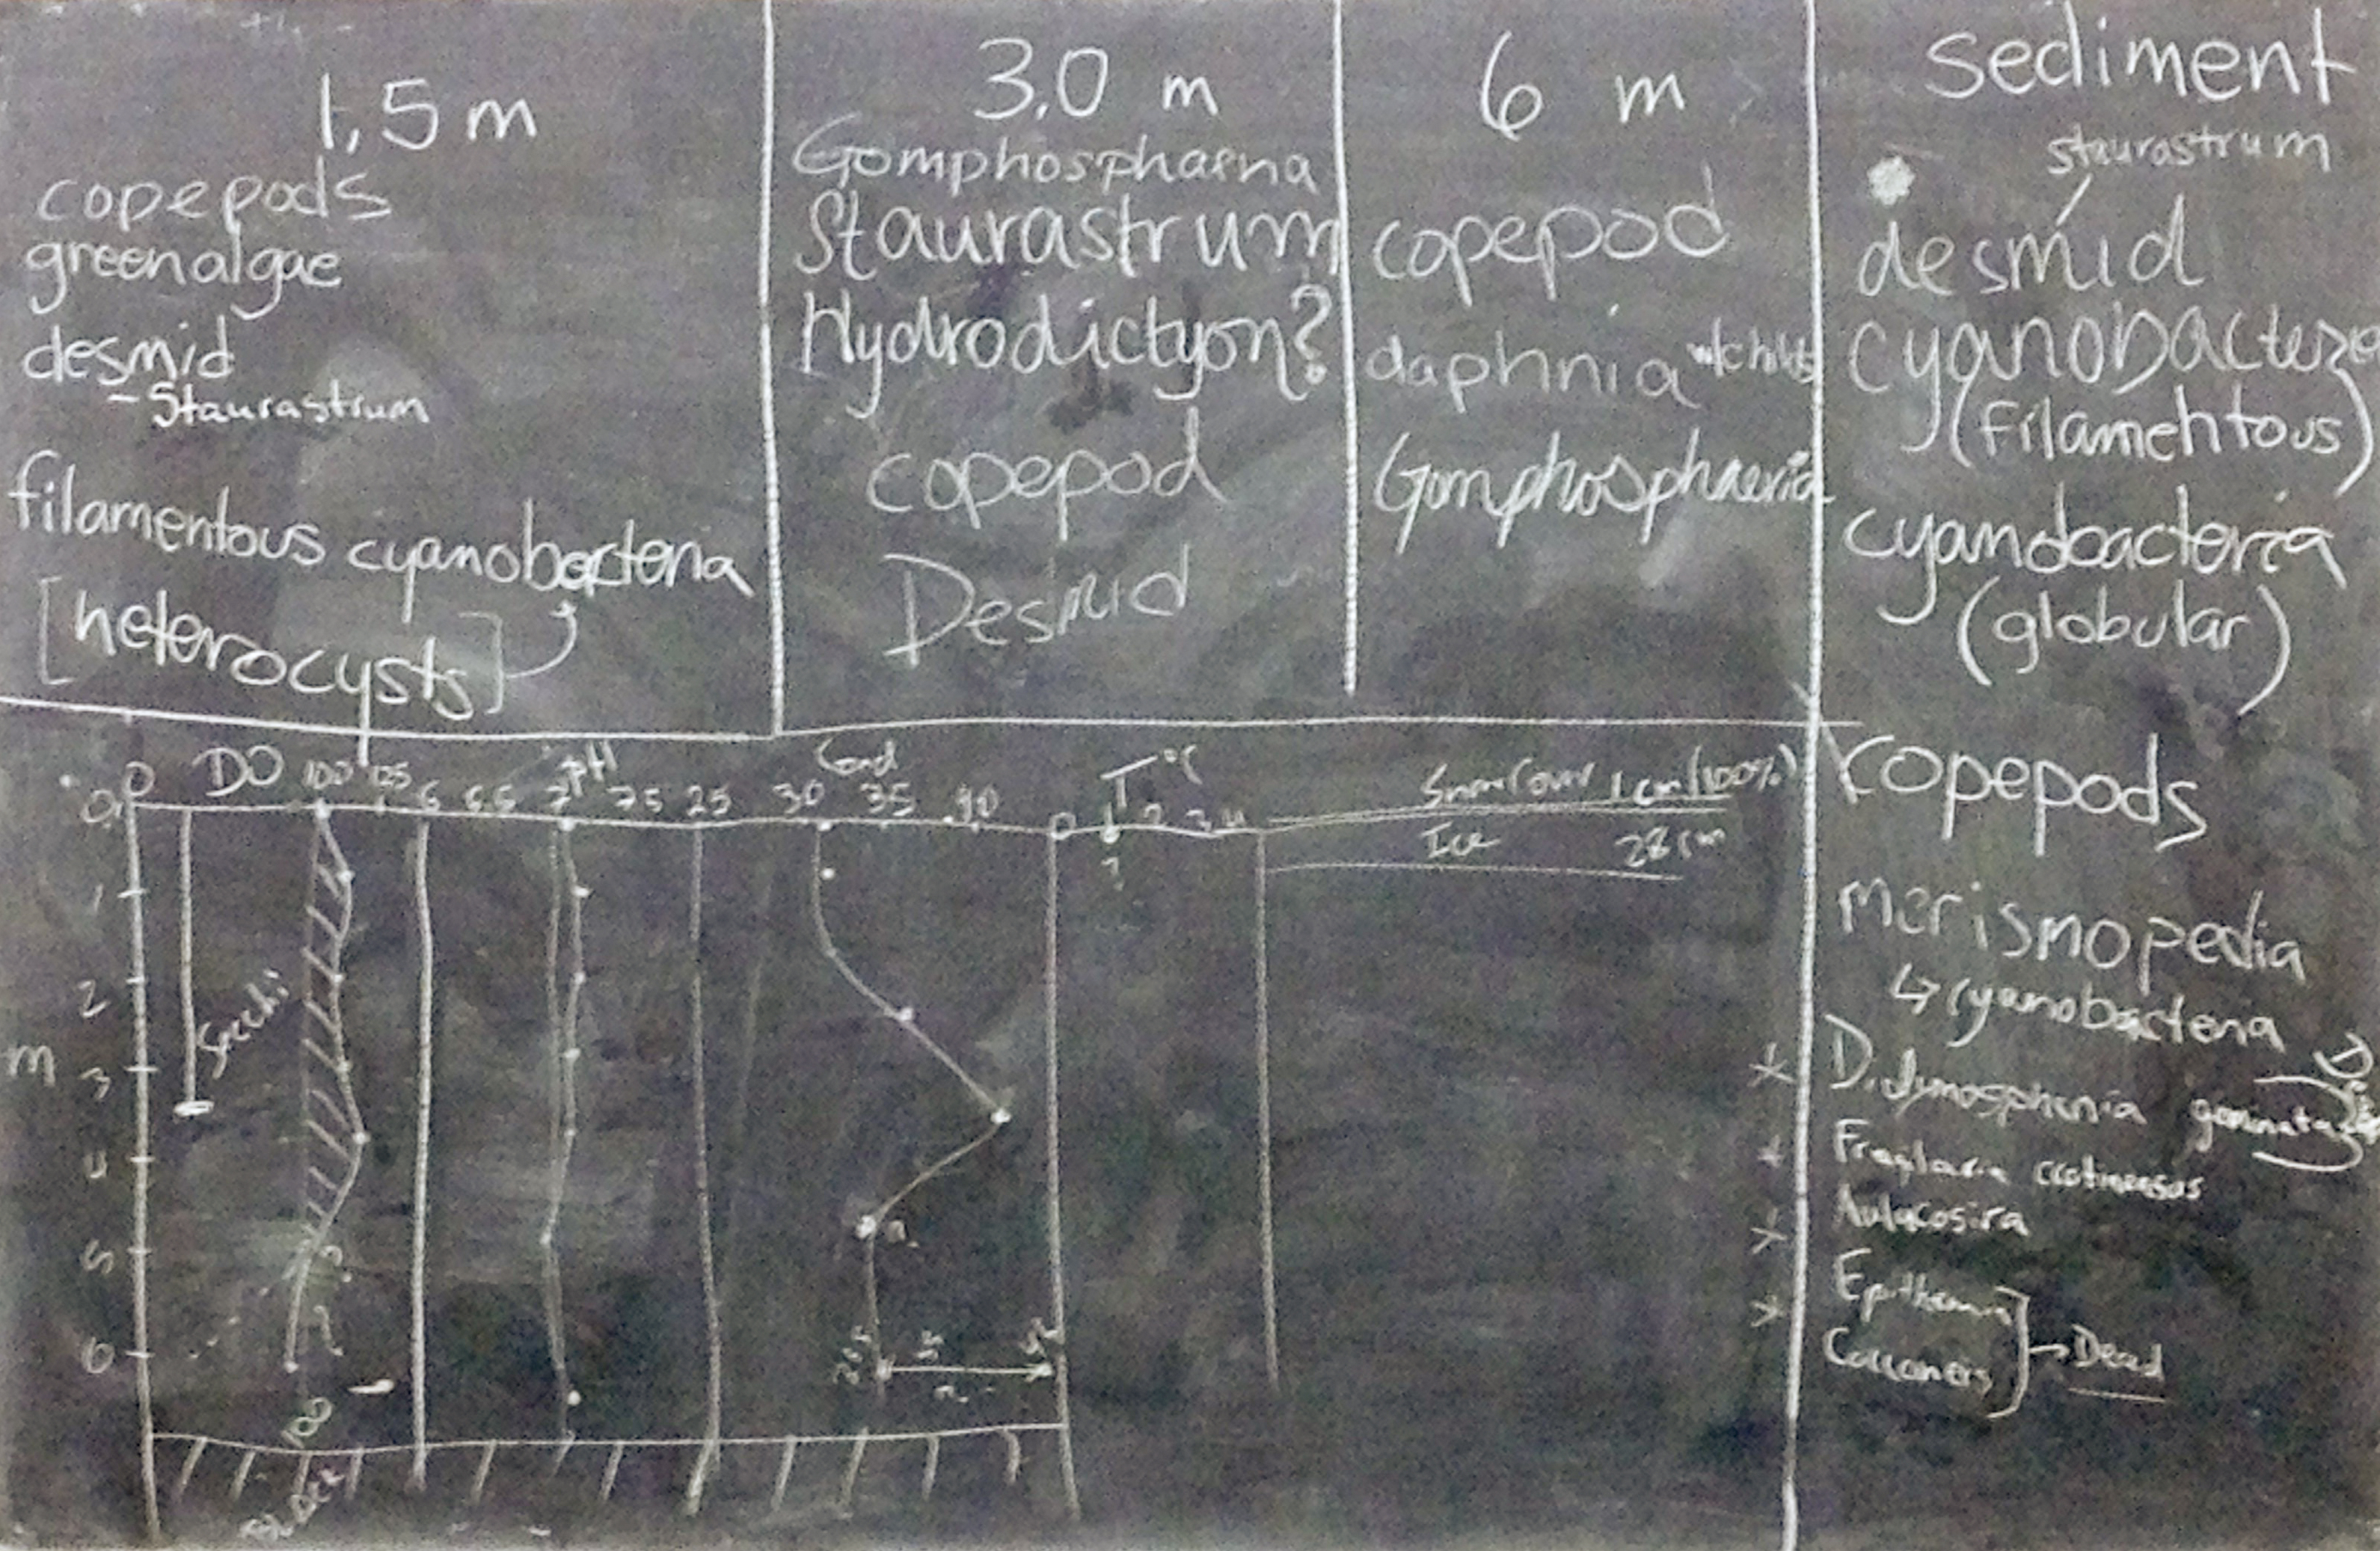
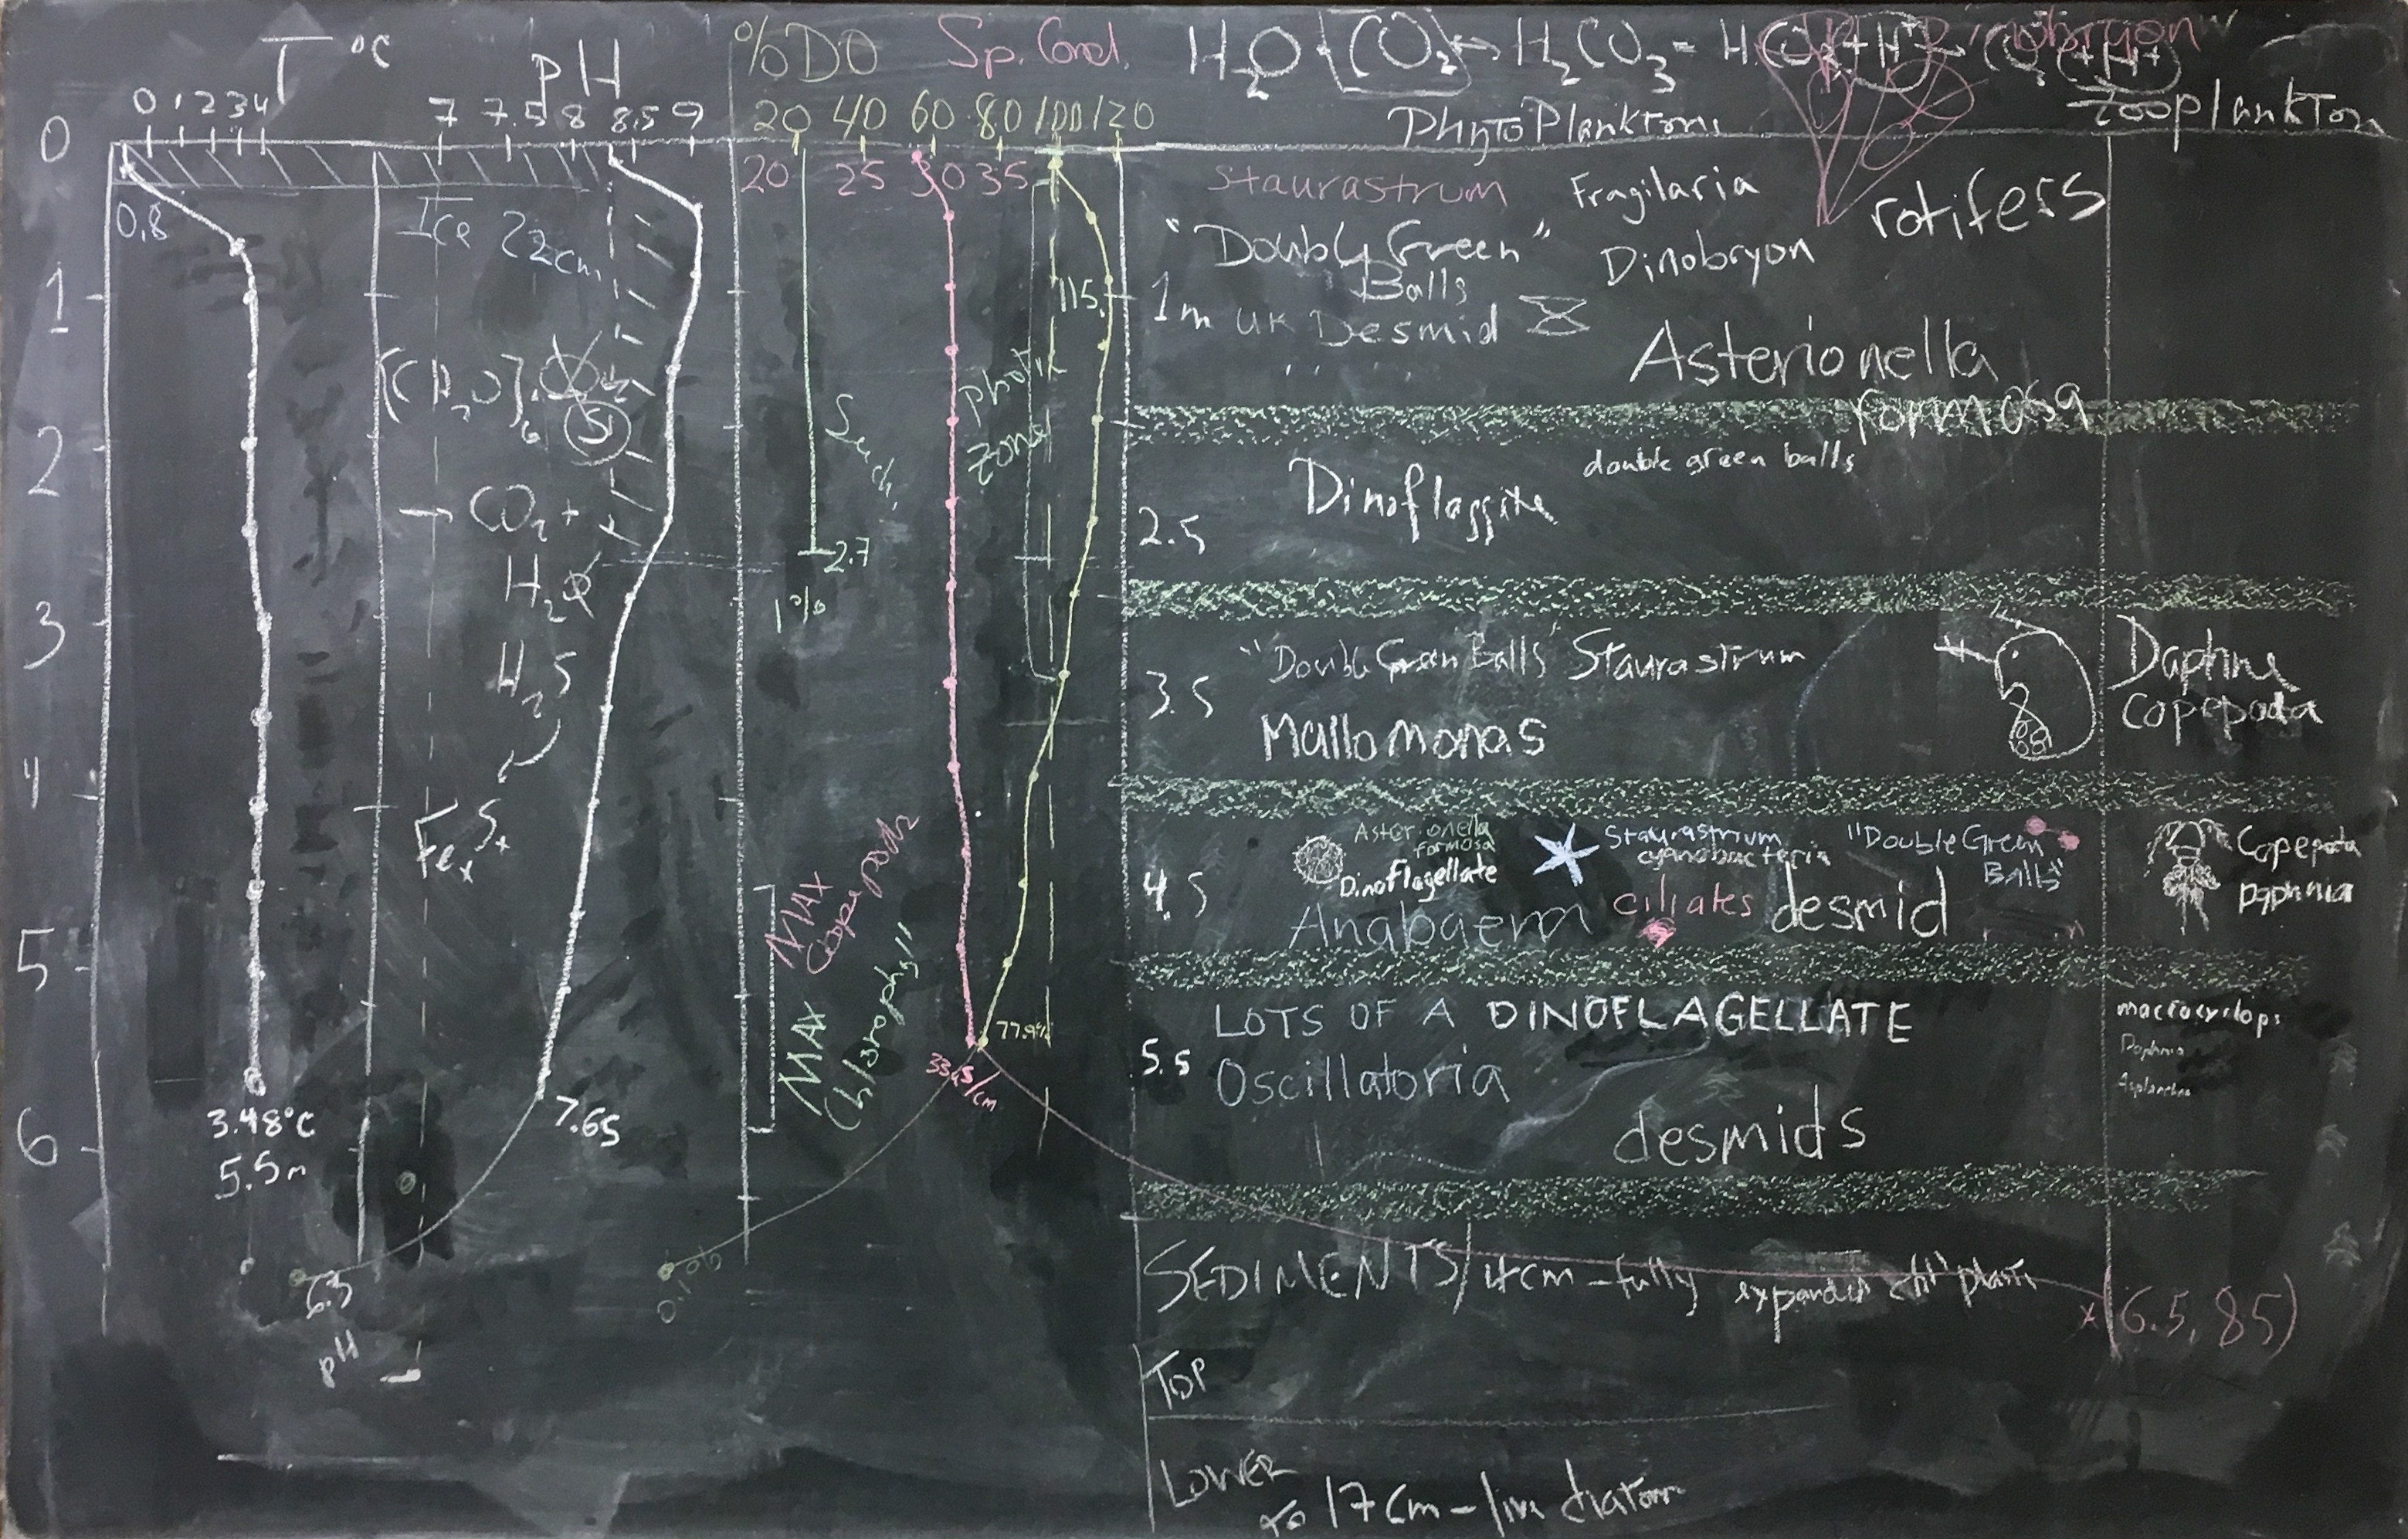
- Profiles: Sonde & Microbes (Blackboard
image, below)
- Separate probes for DO & pH, both with
temperature (tied together).
- Probe depth recorded to 7 m, but lines tangled;
vs. van Dorn bottle depth ~5m
- DO meter calibration adjusted for 100% at
surface. Peak 104% at 1 & 1.5 m.
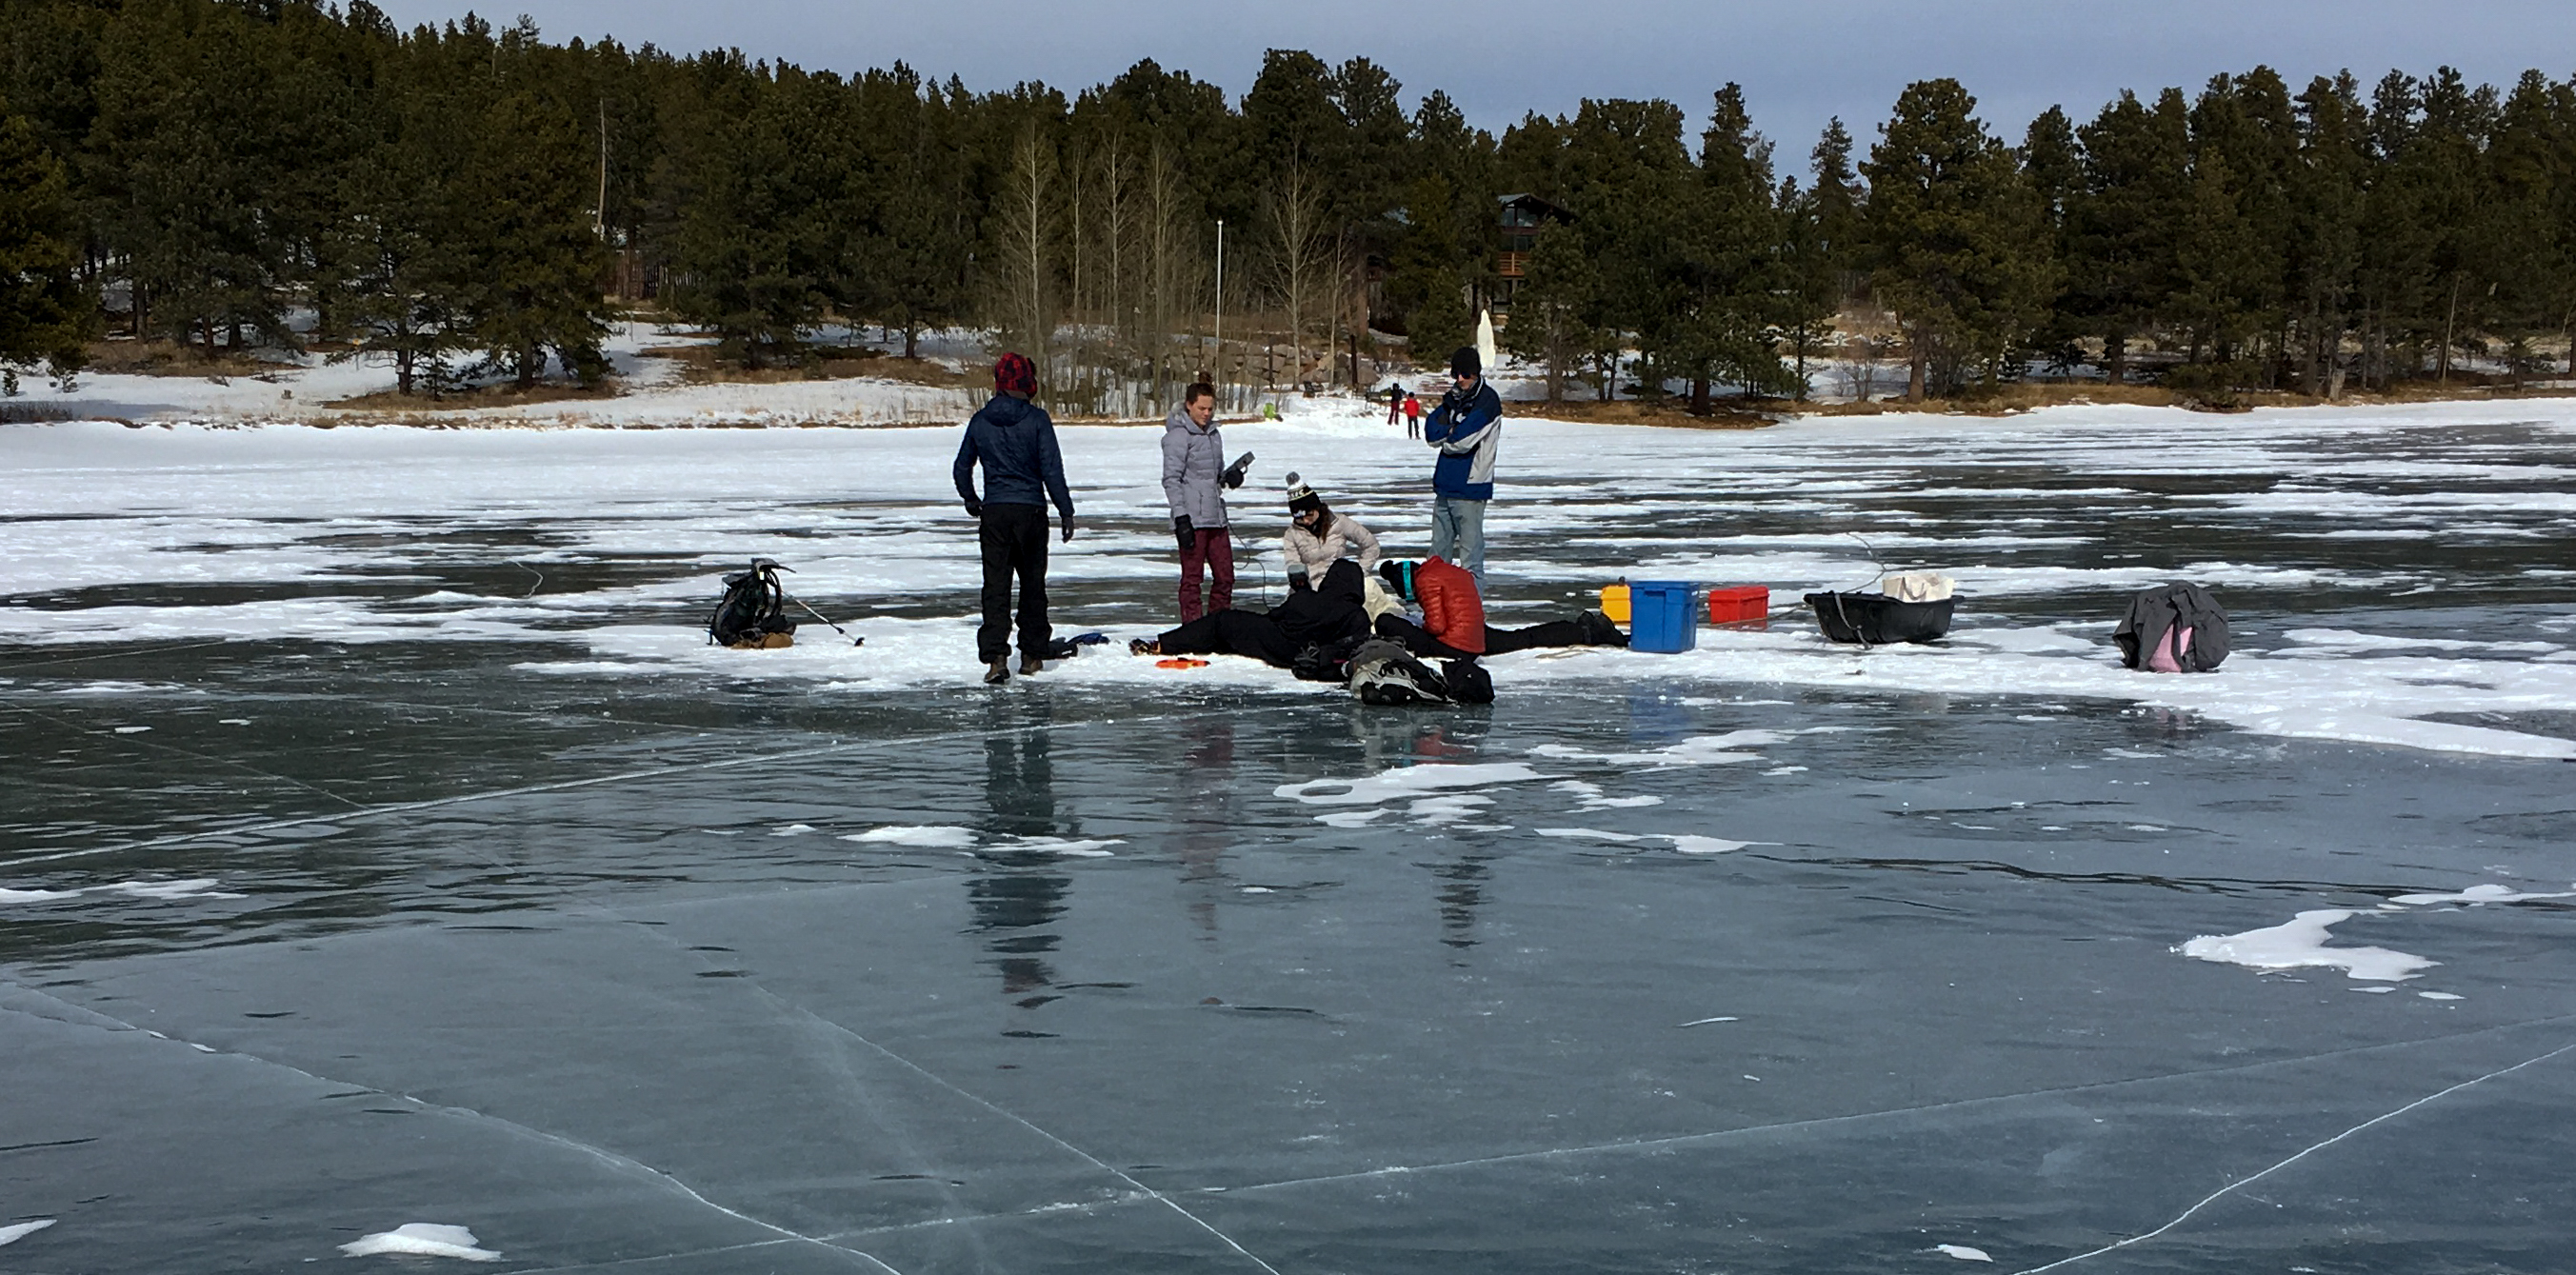
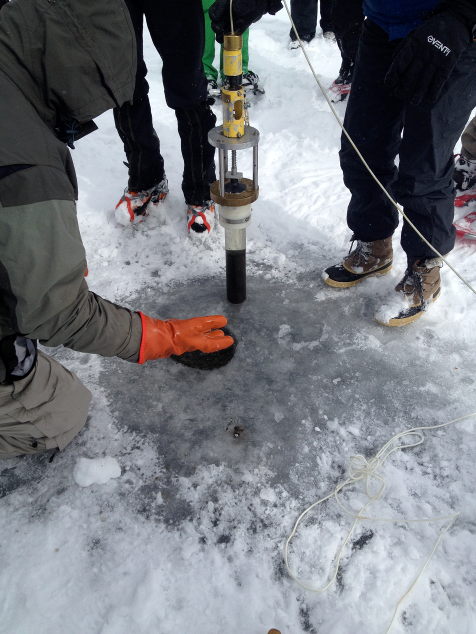
- Lake partly snow-covered (see photos)
- Ice thickness 29-31 cm, varying by hole
- Seechi disk depth = 2.9-3.0 m (~10% surface light)
- Datasheet (pdf,
500k)
Click images to enlarge
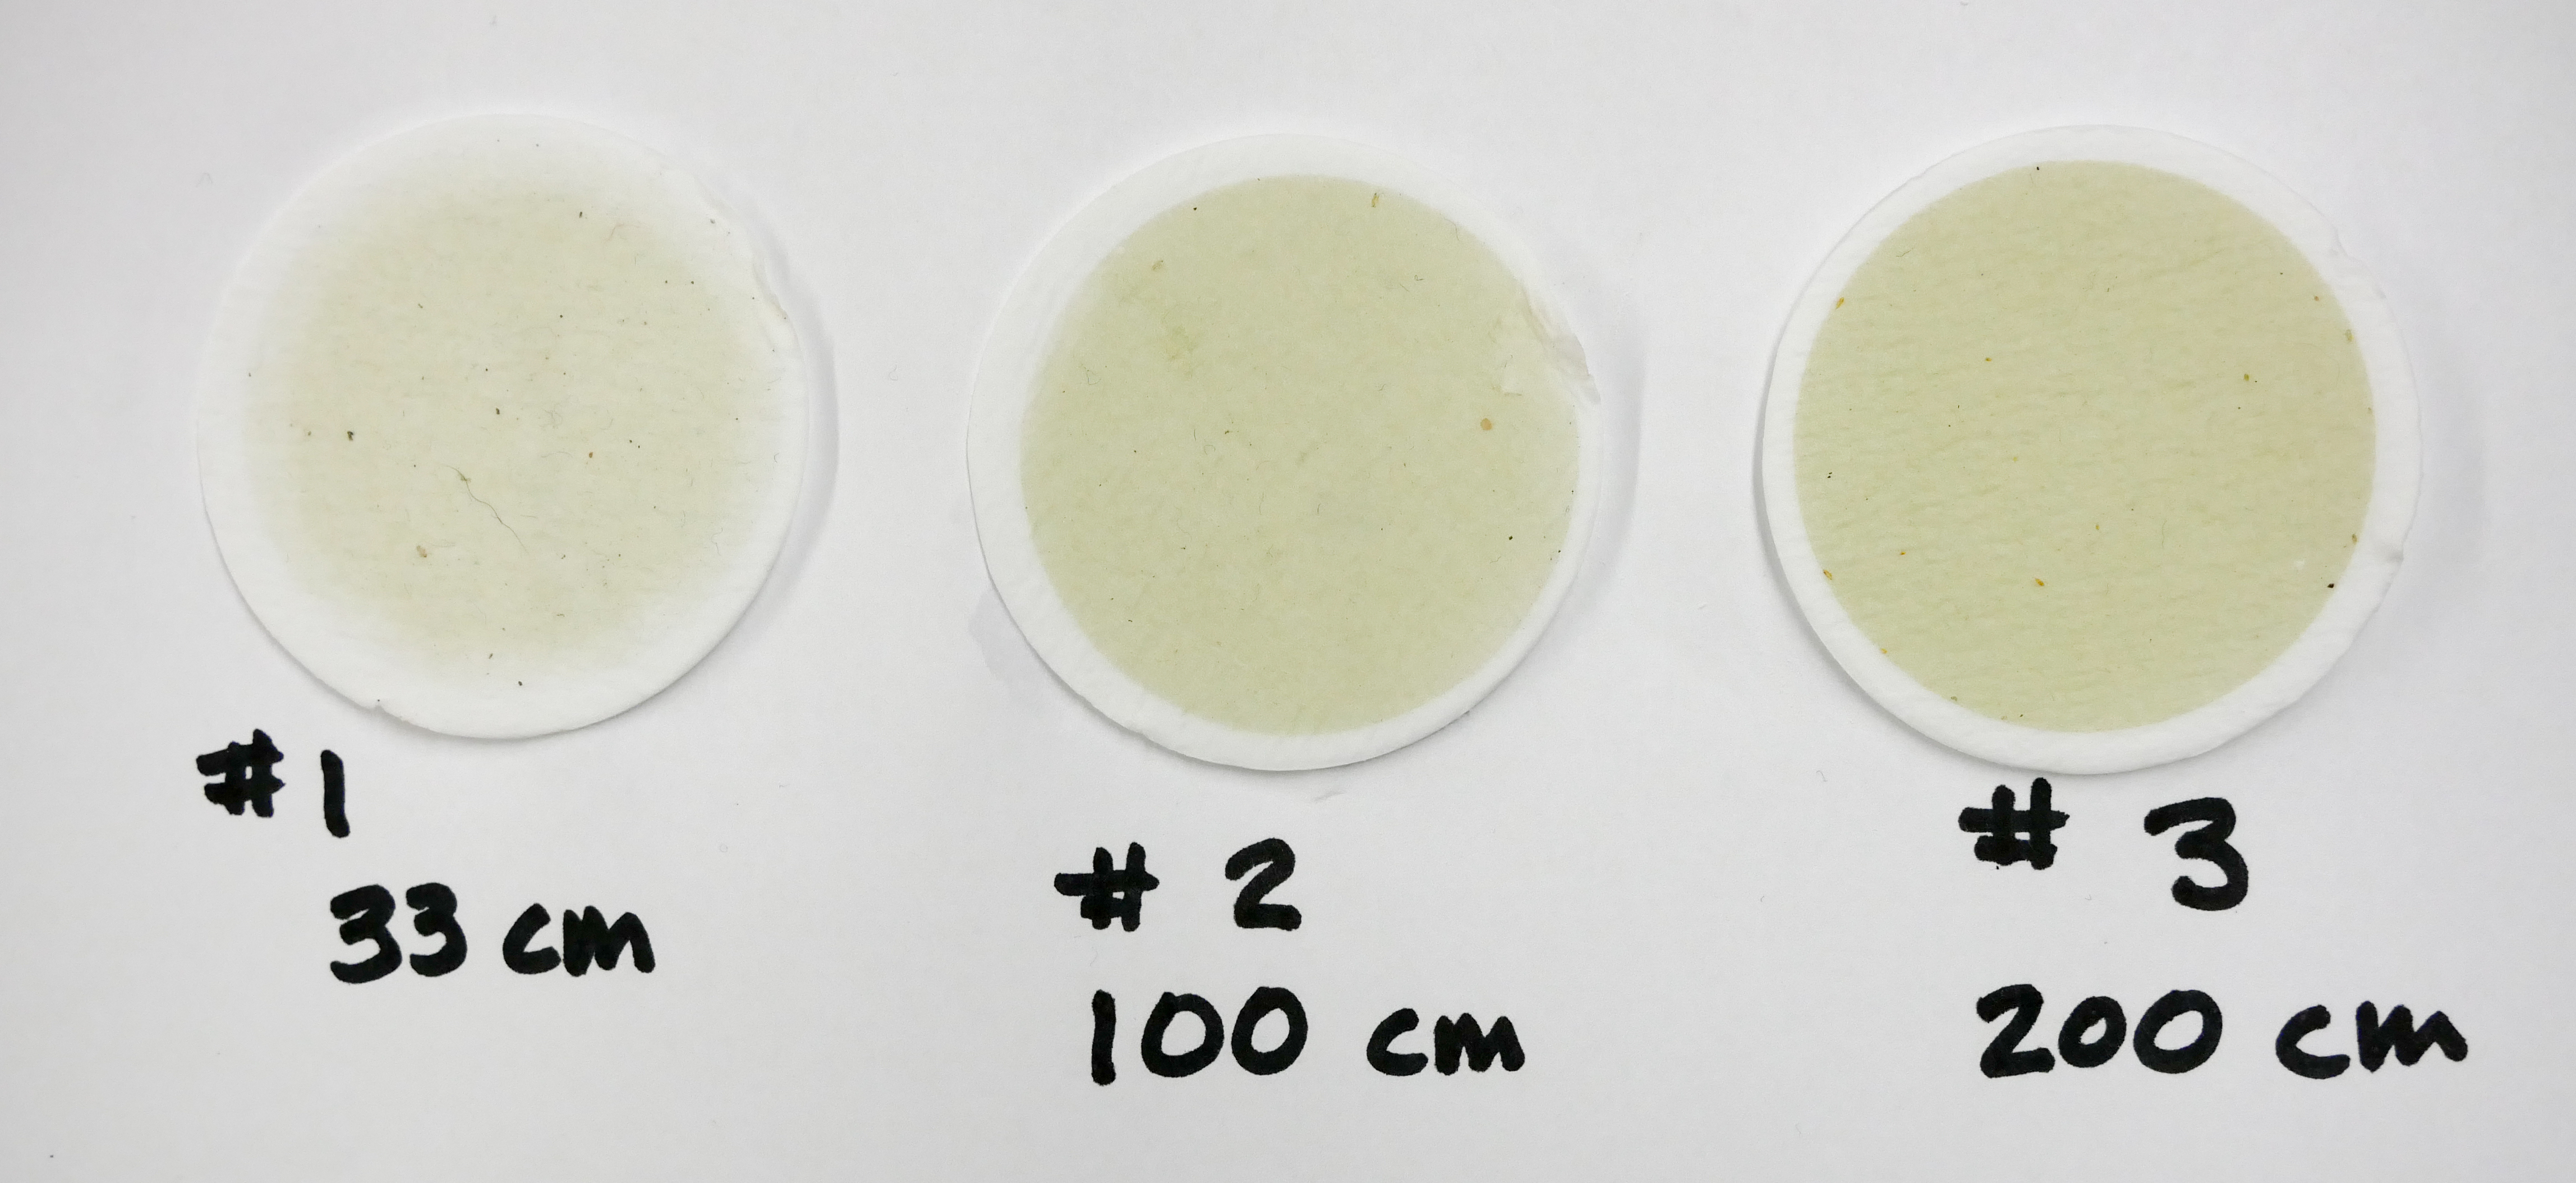
- Profiles: Filters
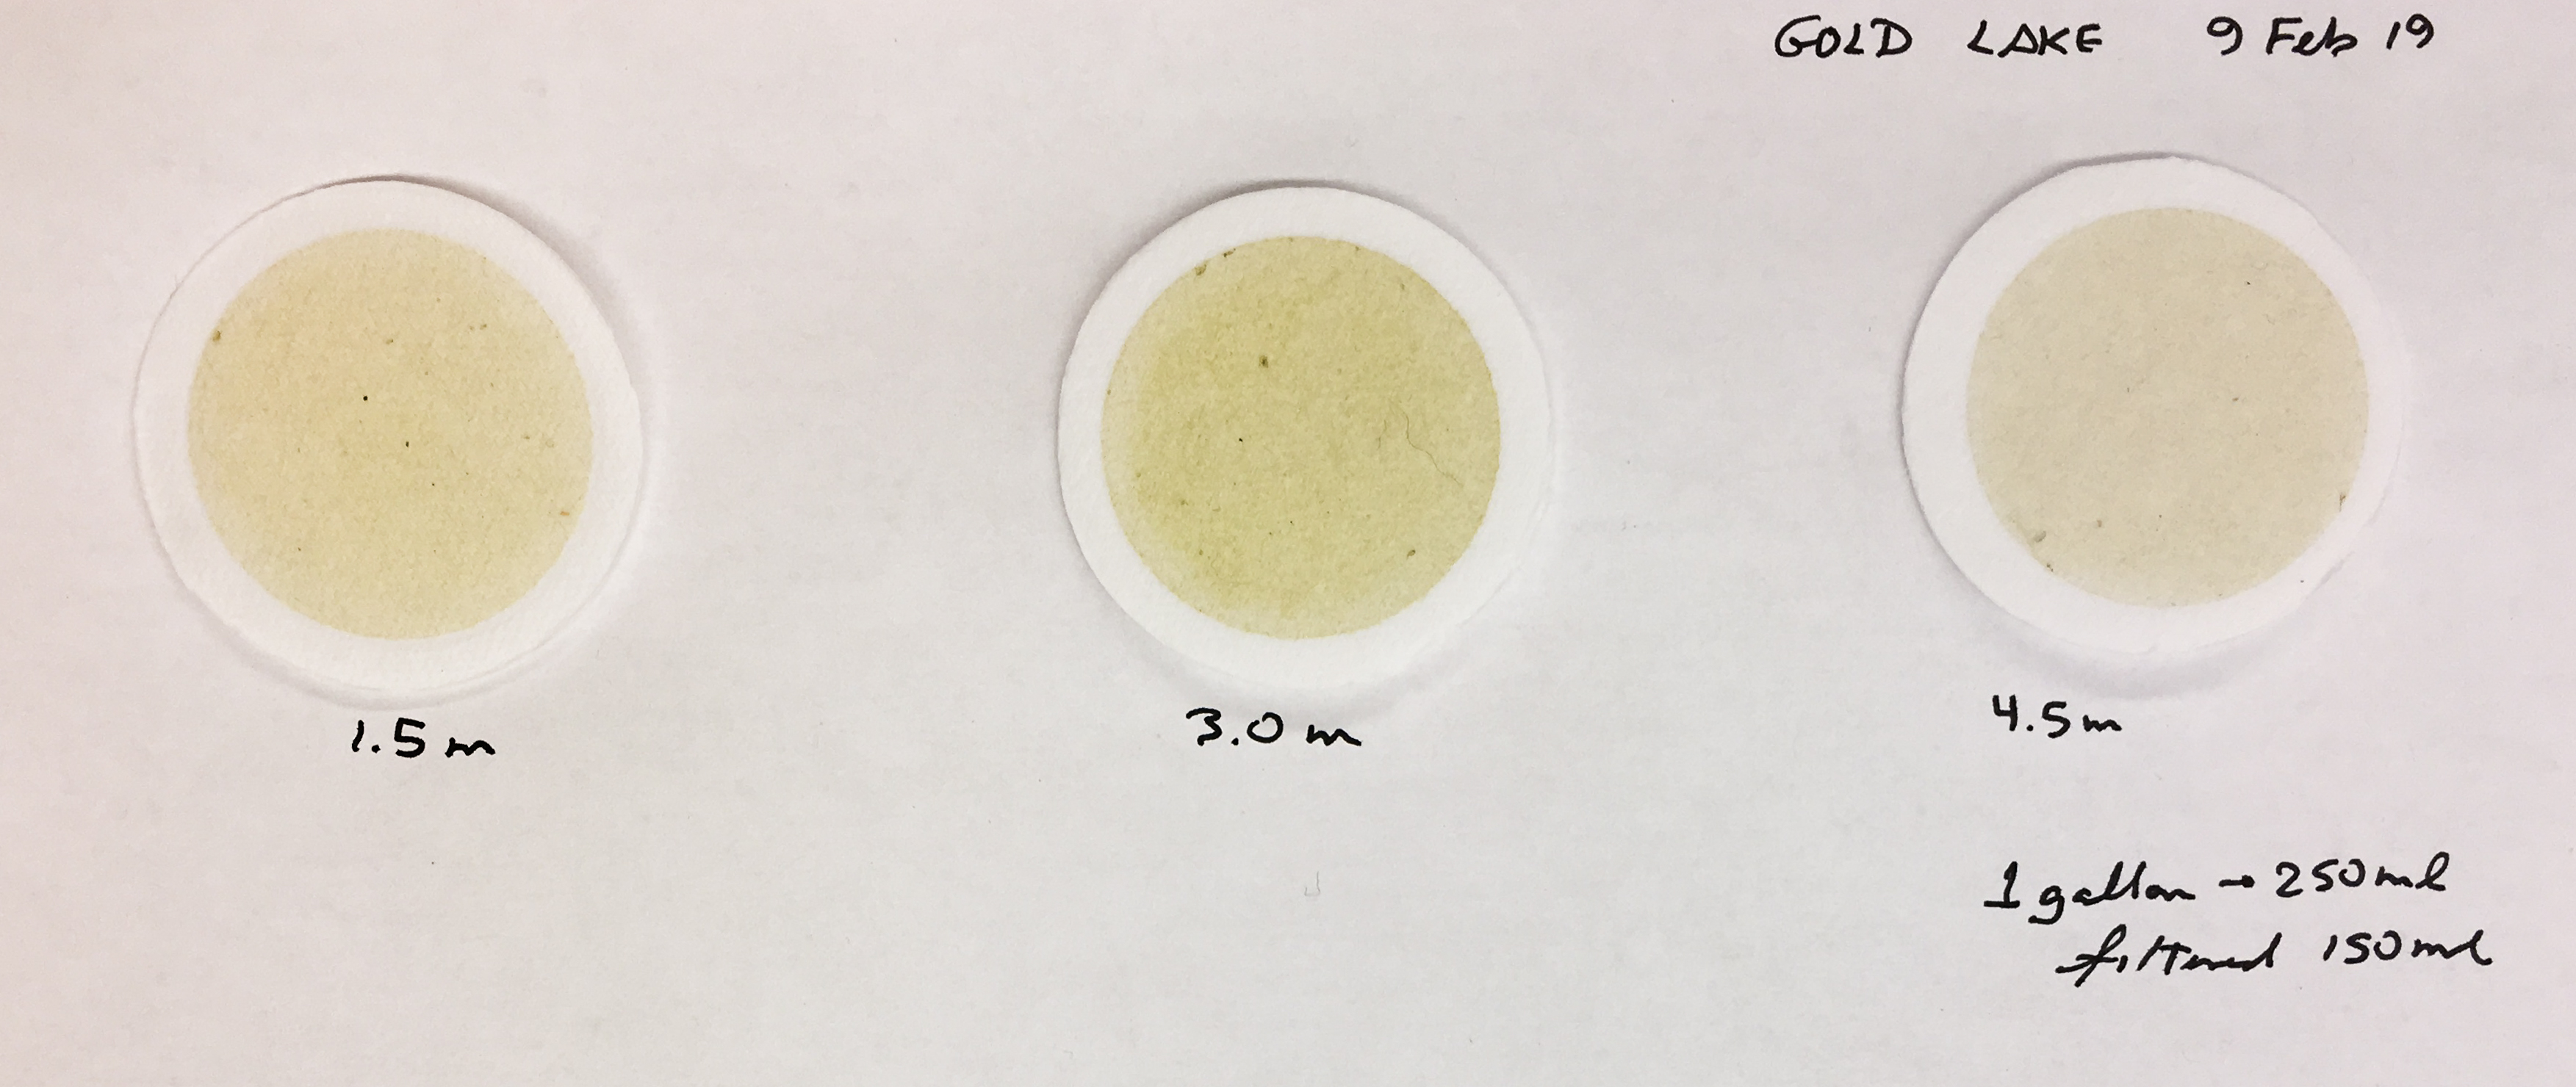
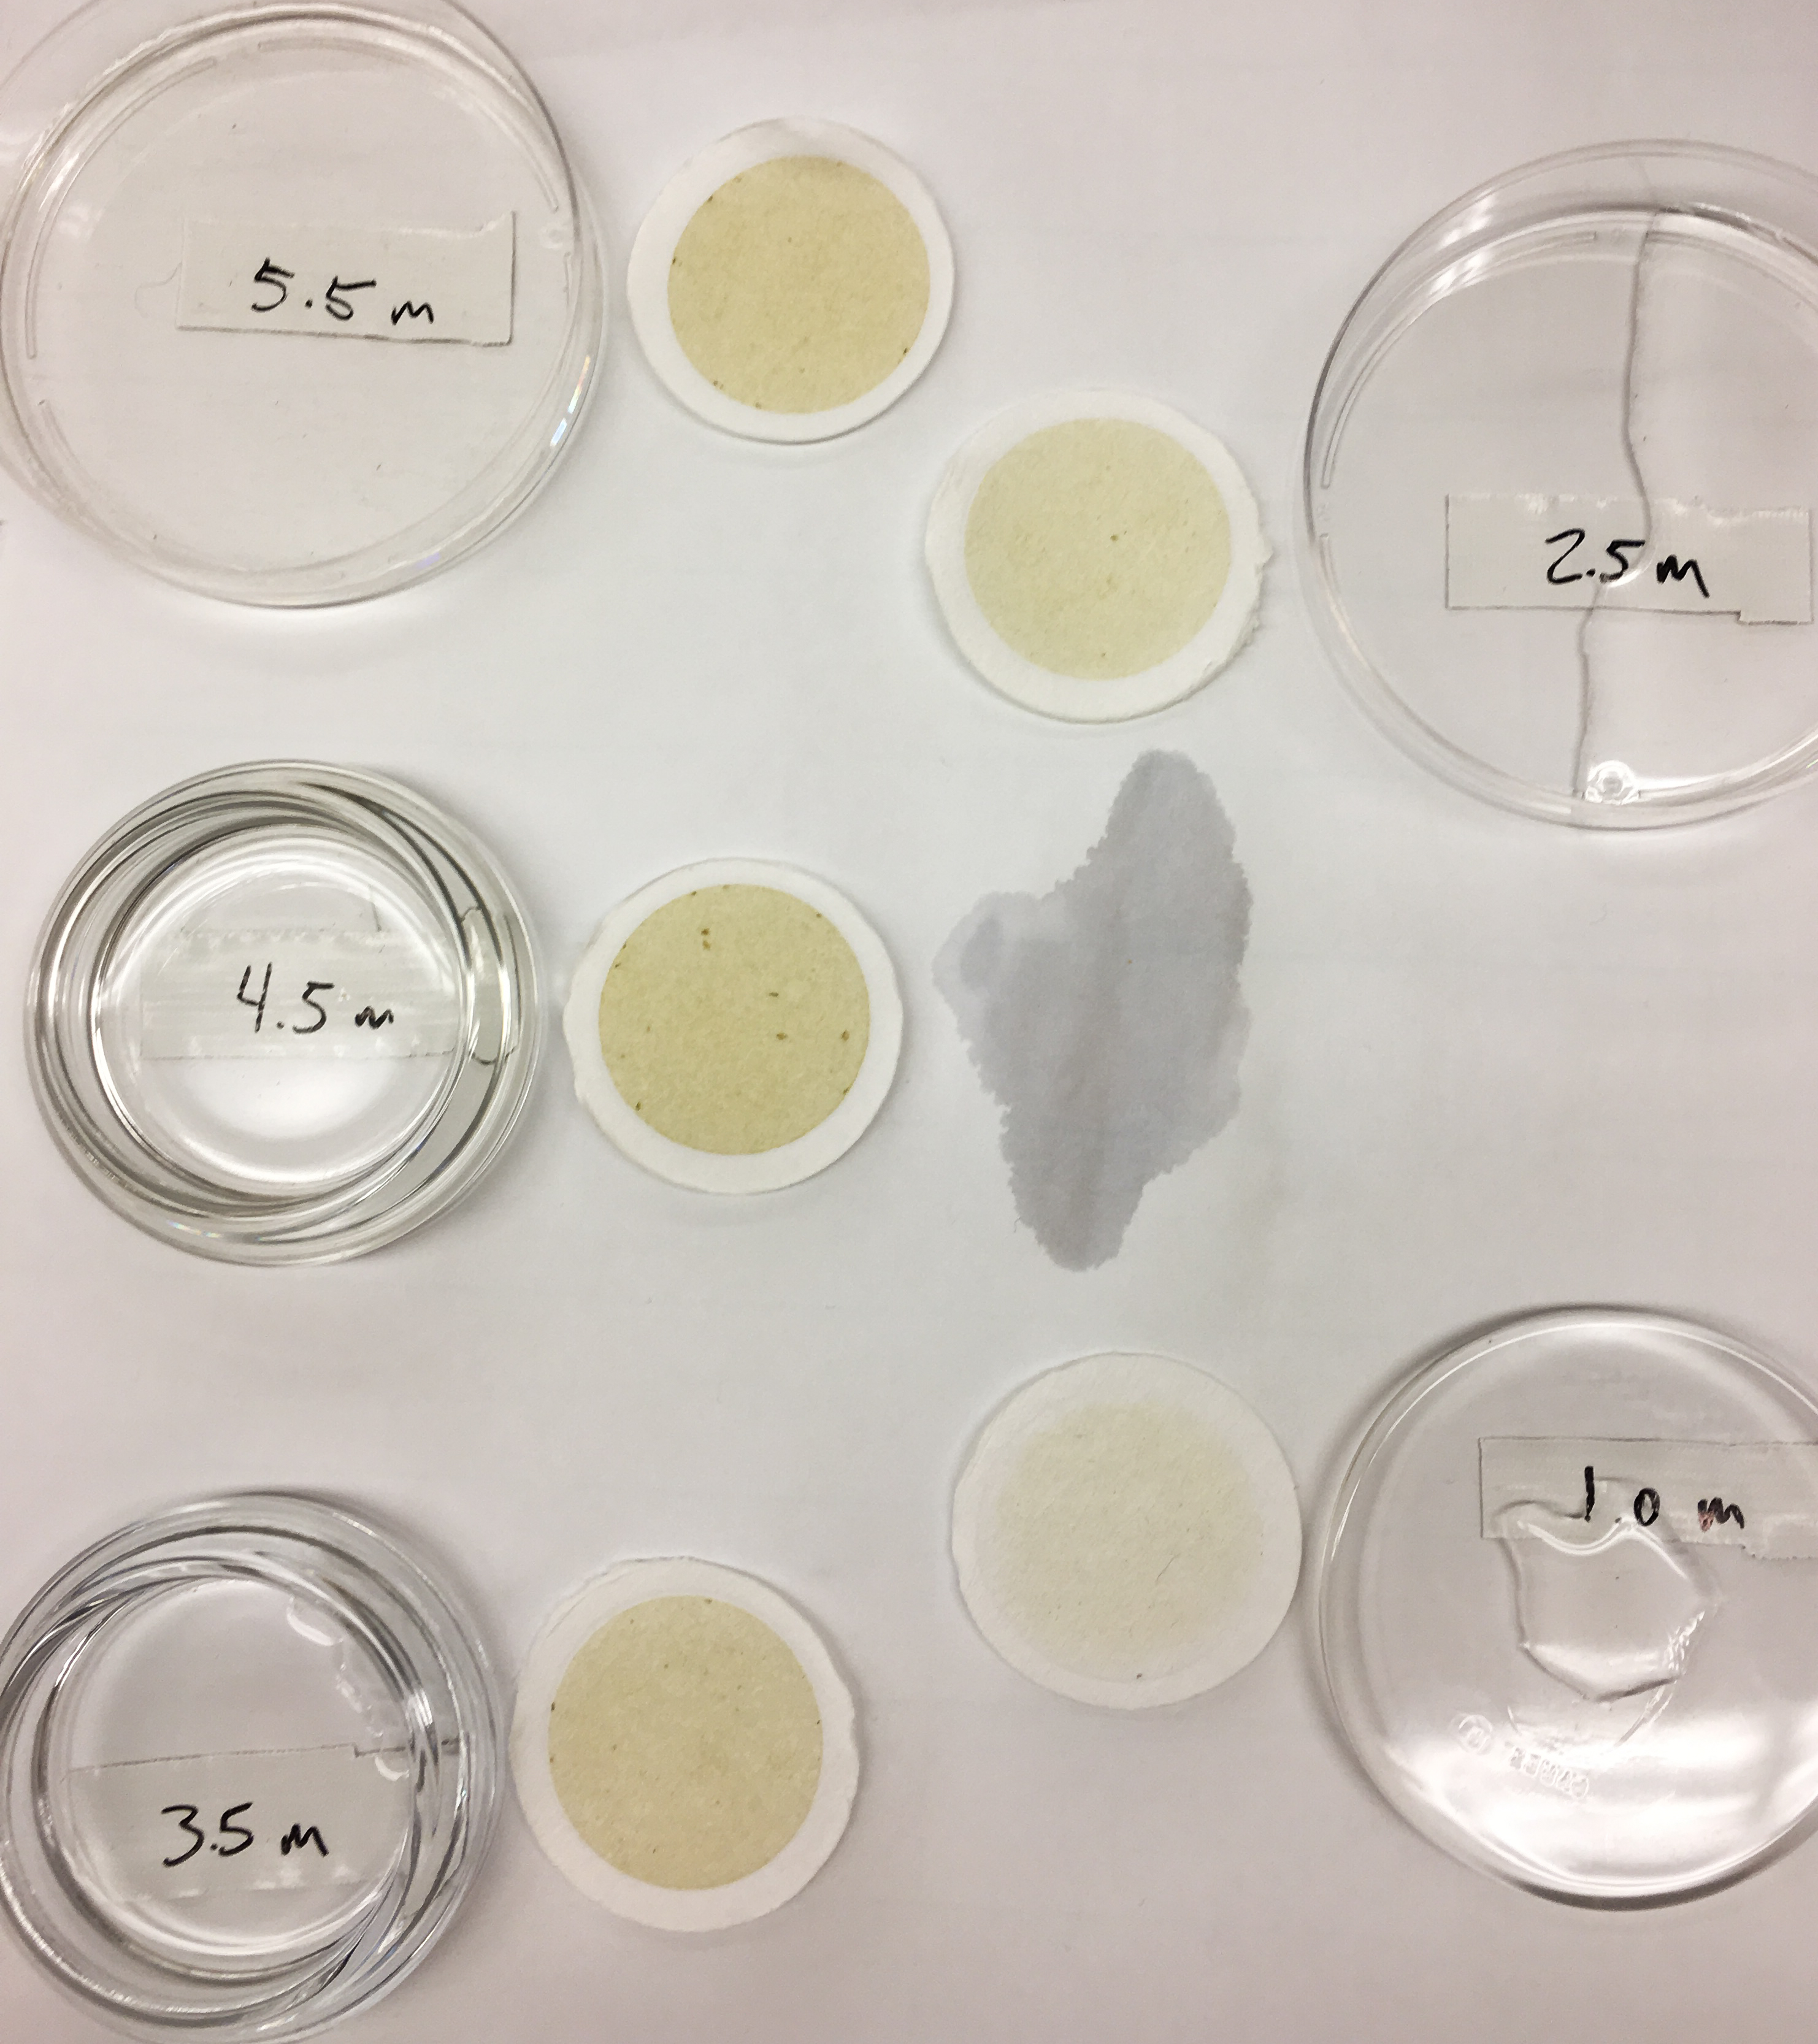
- Color (i.e. phytoplankton concentrations)
strongest at 3.0-meter samples
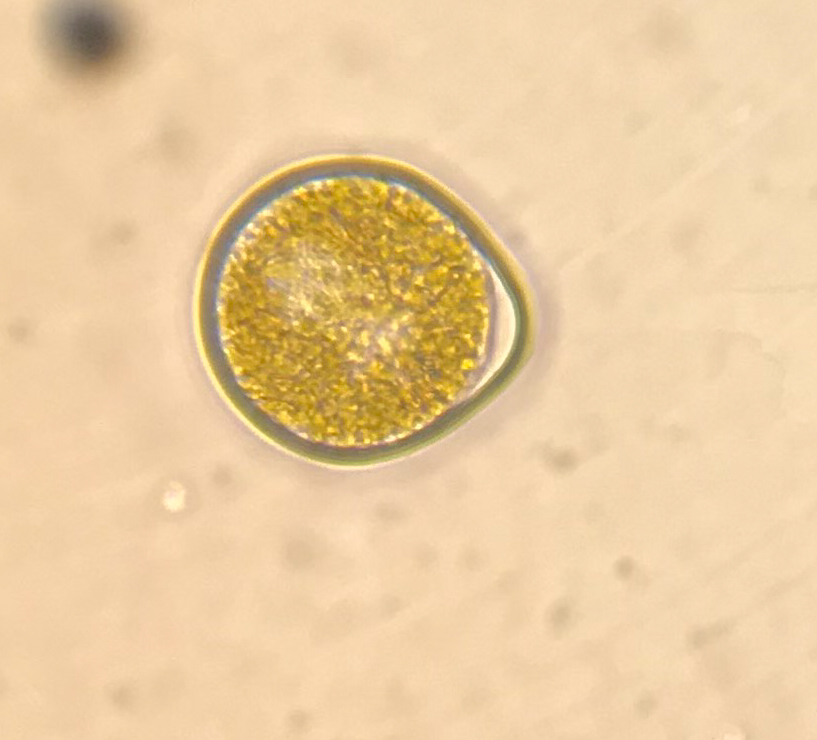
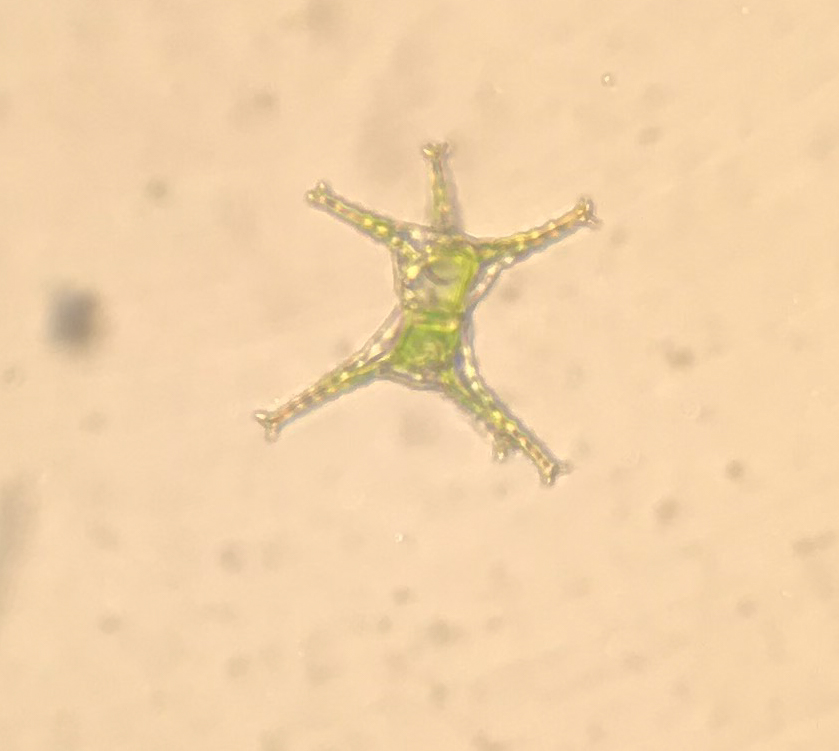
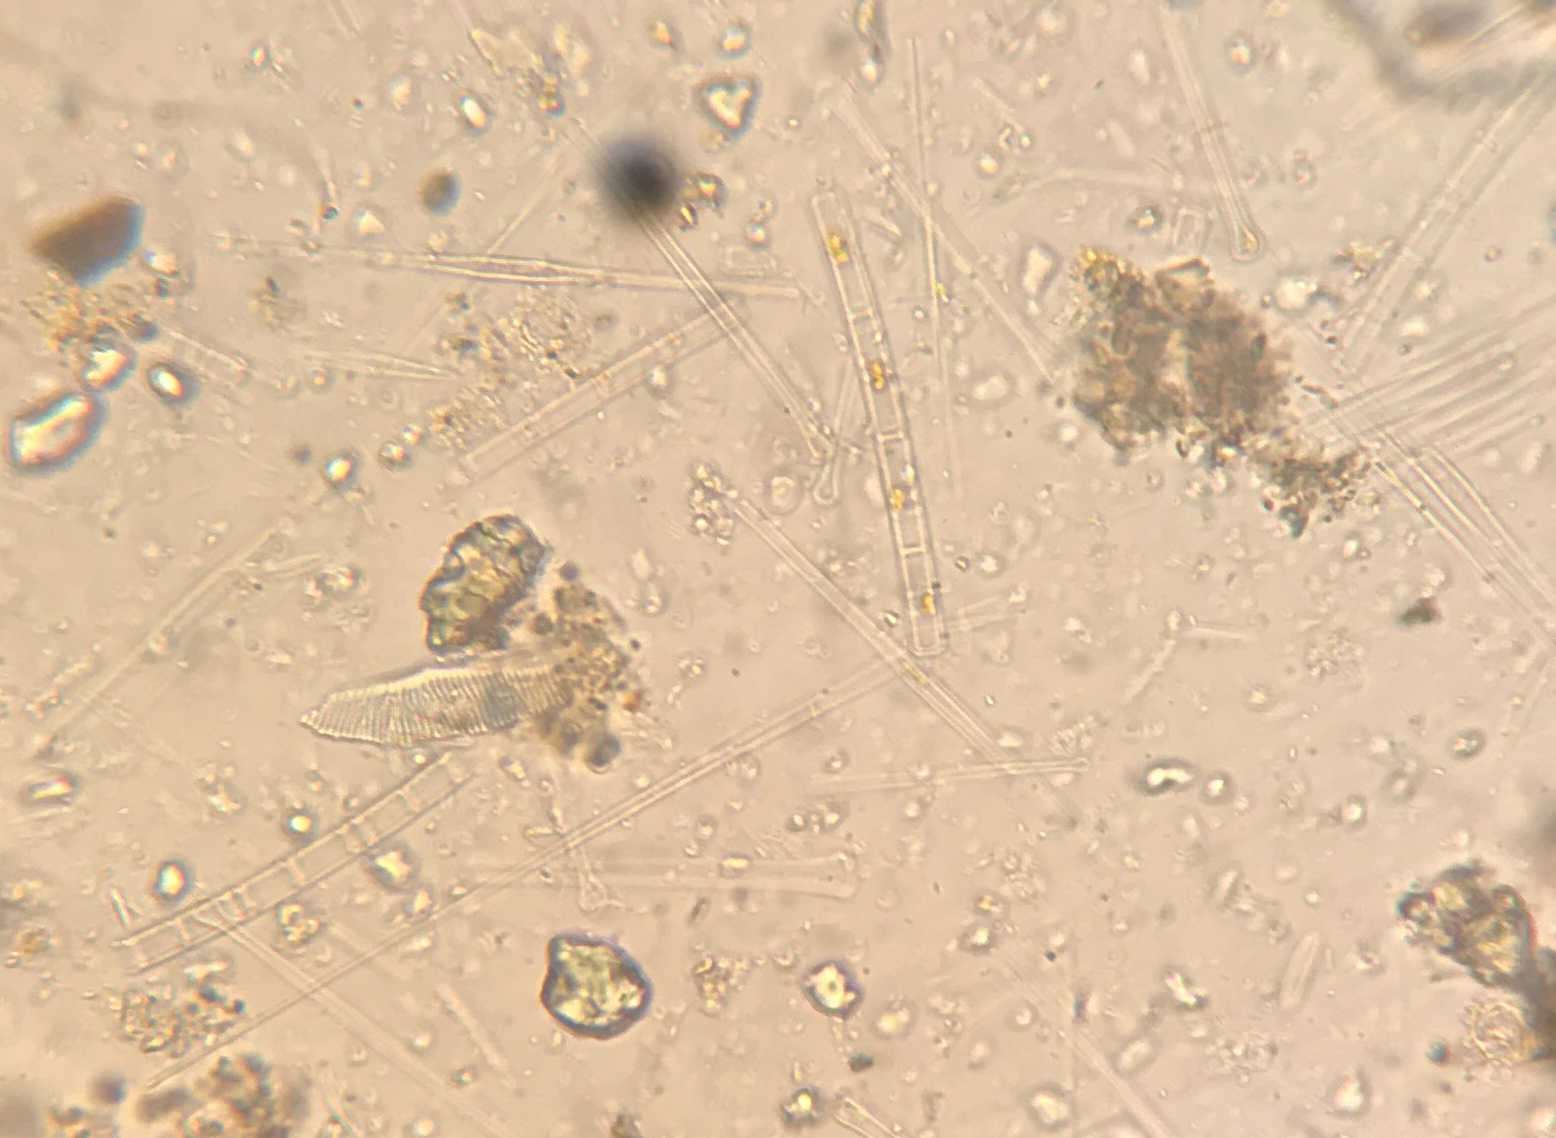
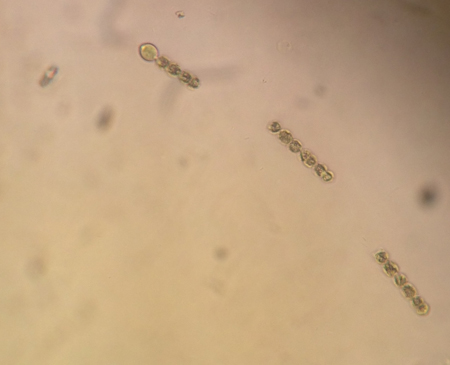
- Color = yellow green (green algae, cyanobacteria,
and diatoms observed in microscope work)
- Zooplankton (copepods) all sample depths
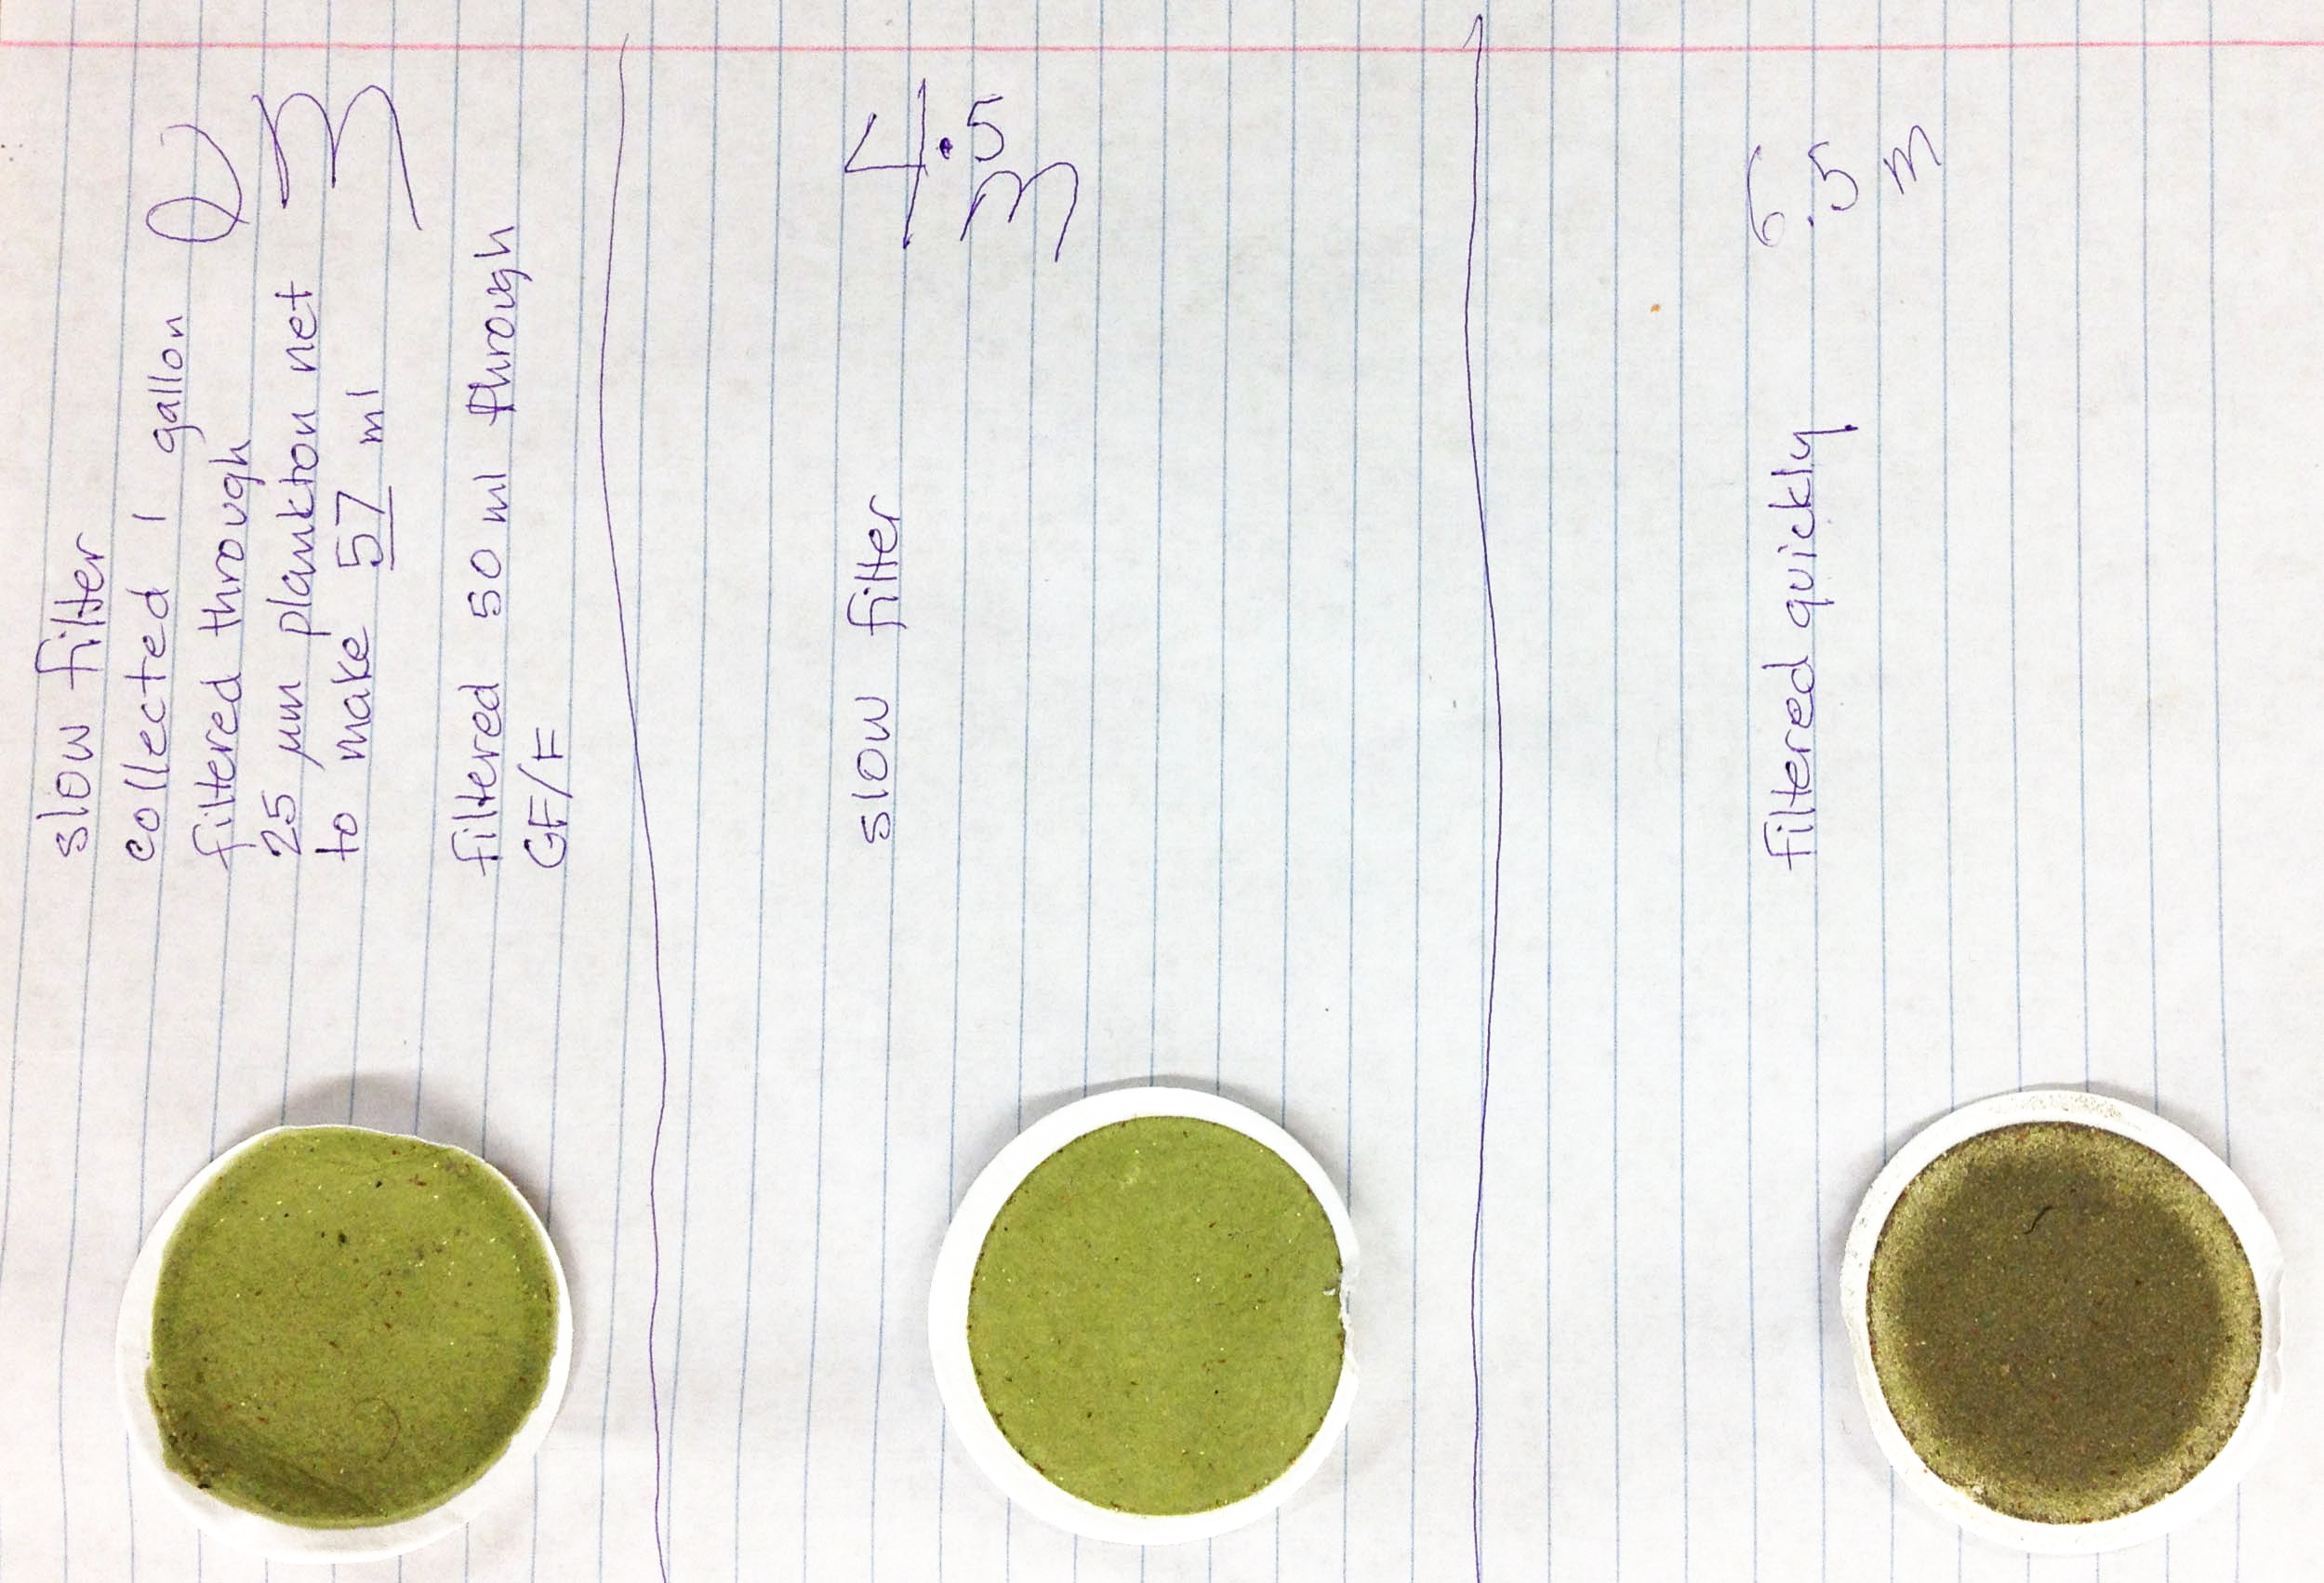
- From 1 gallon through 25 micron mesh plankton net,
concentrated to 250 ml - 150 ml filtered.
|
Click images to
enlarge
photos
(c) T Kittel
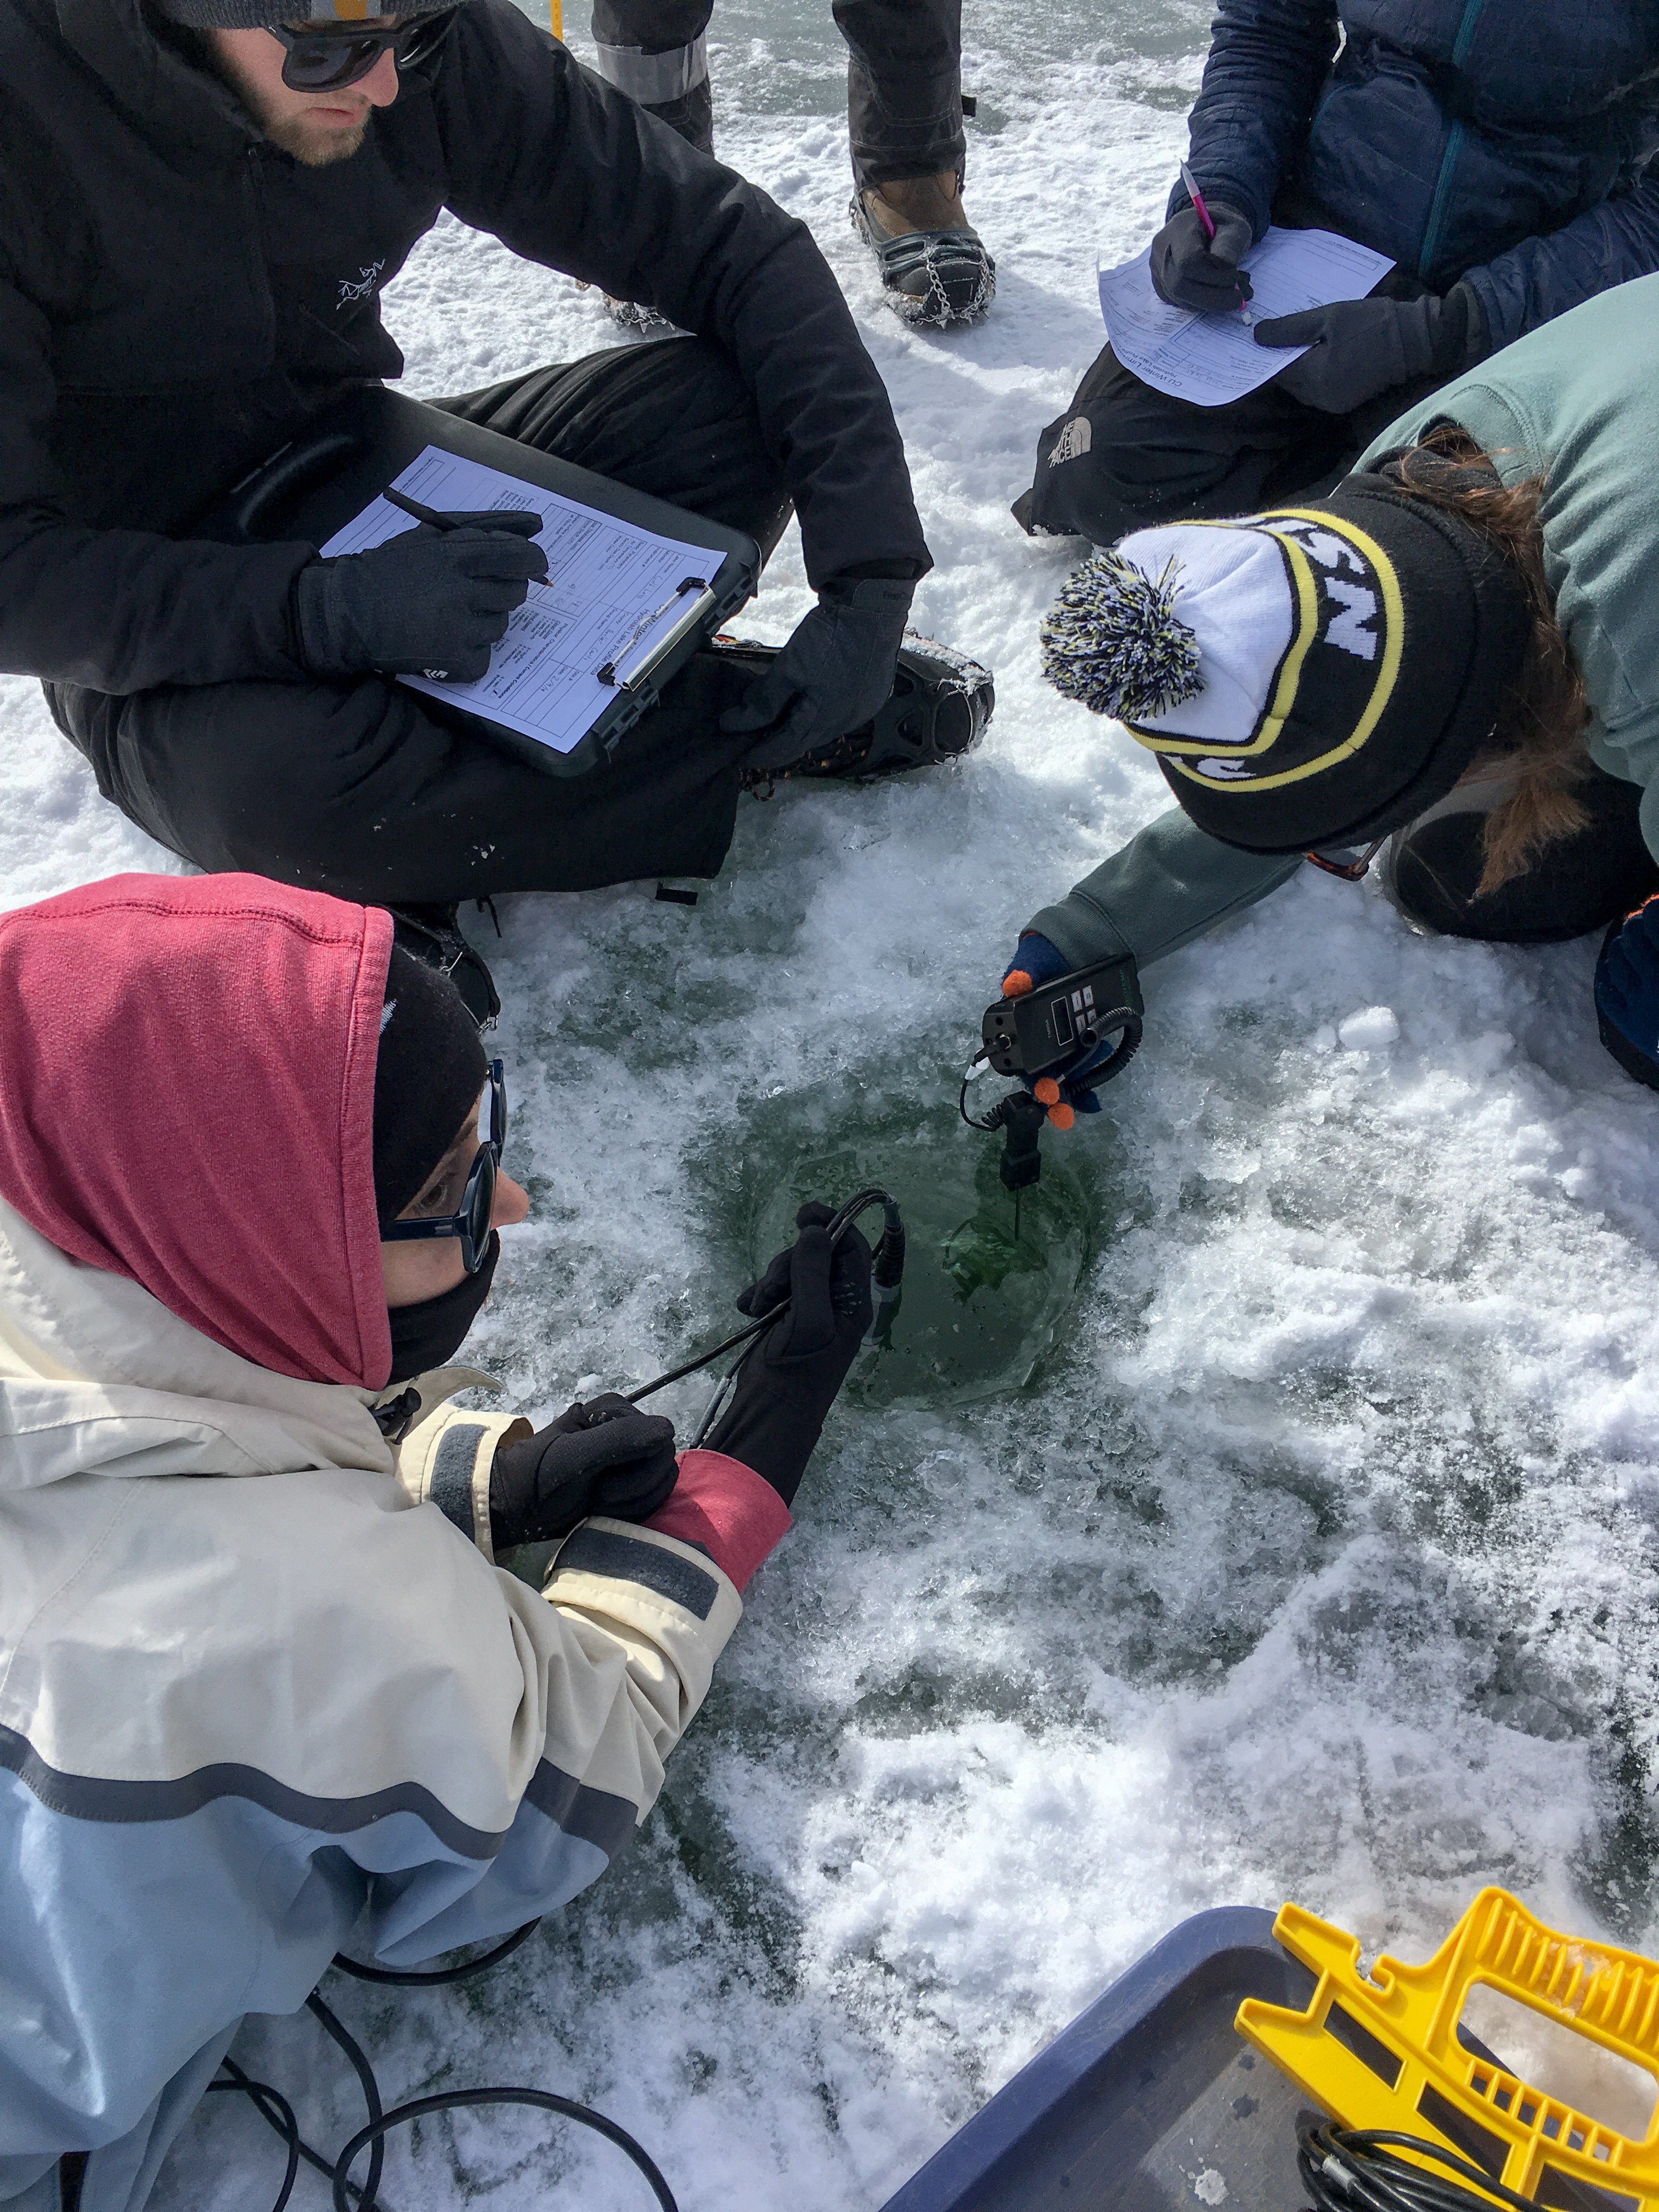
DO, pH, temperature sampling
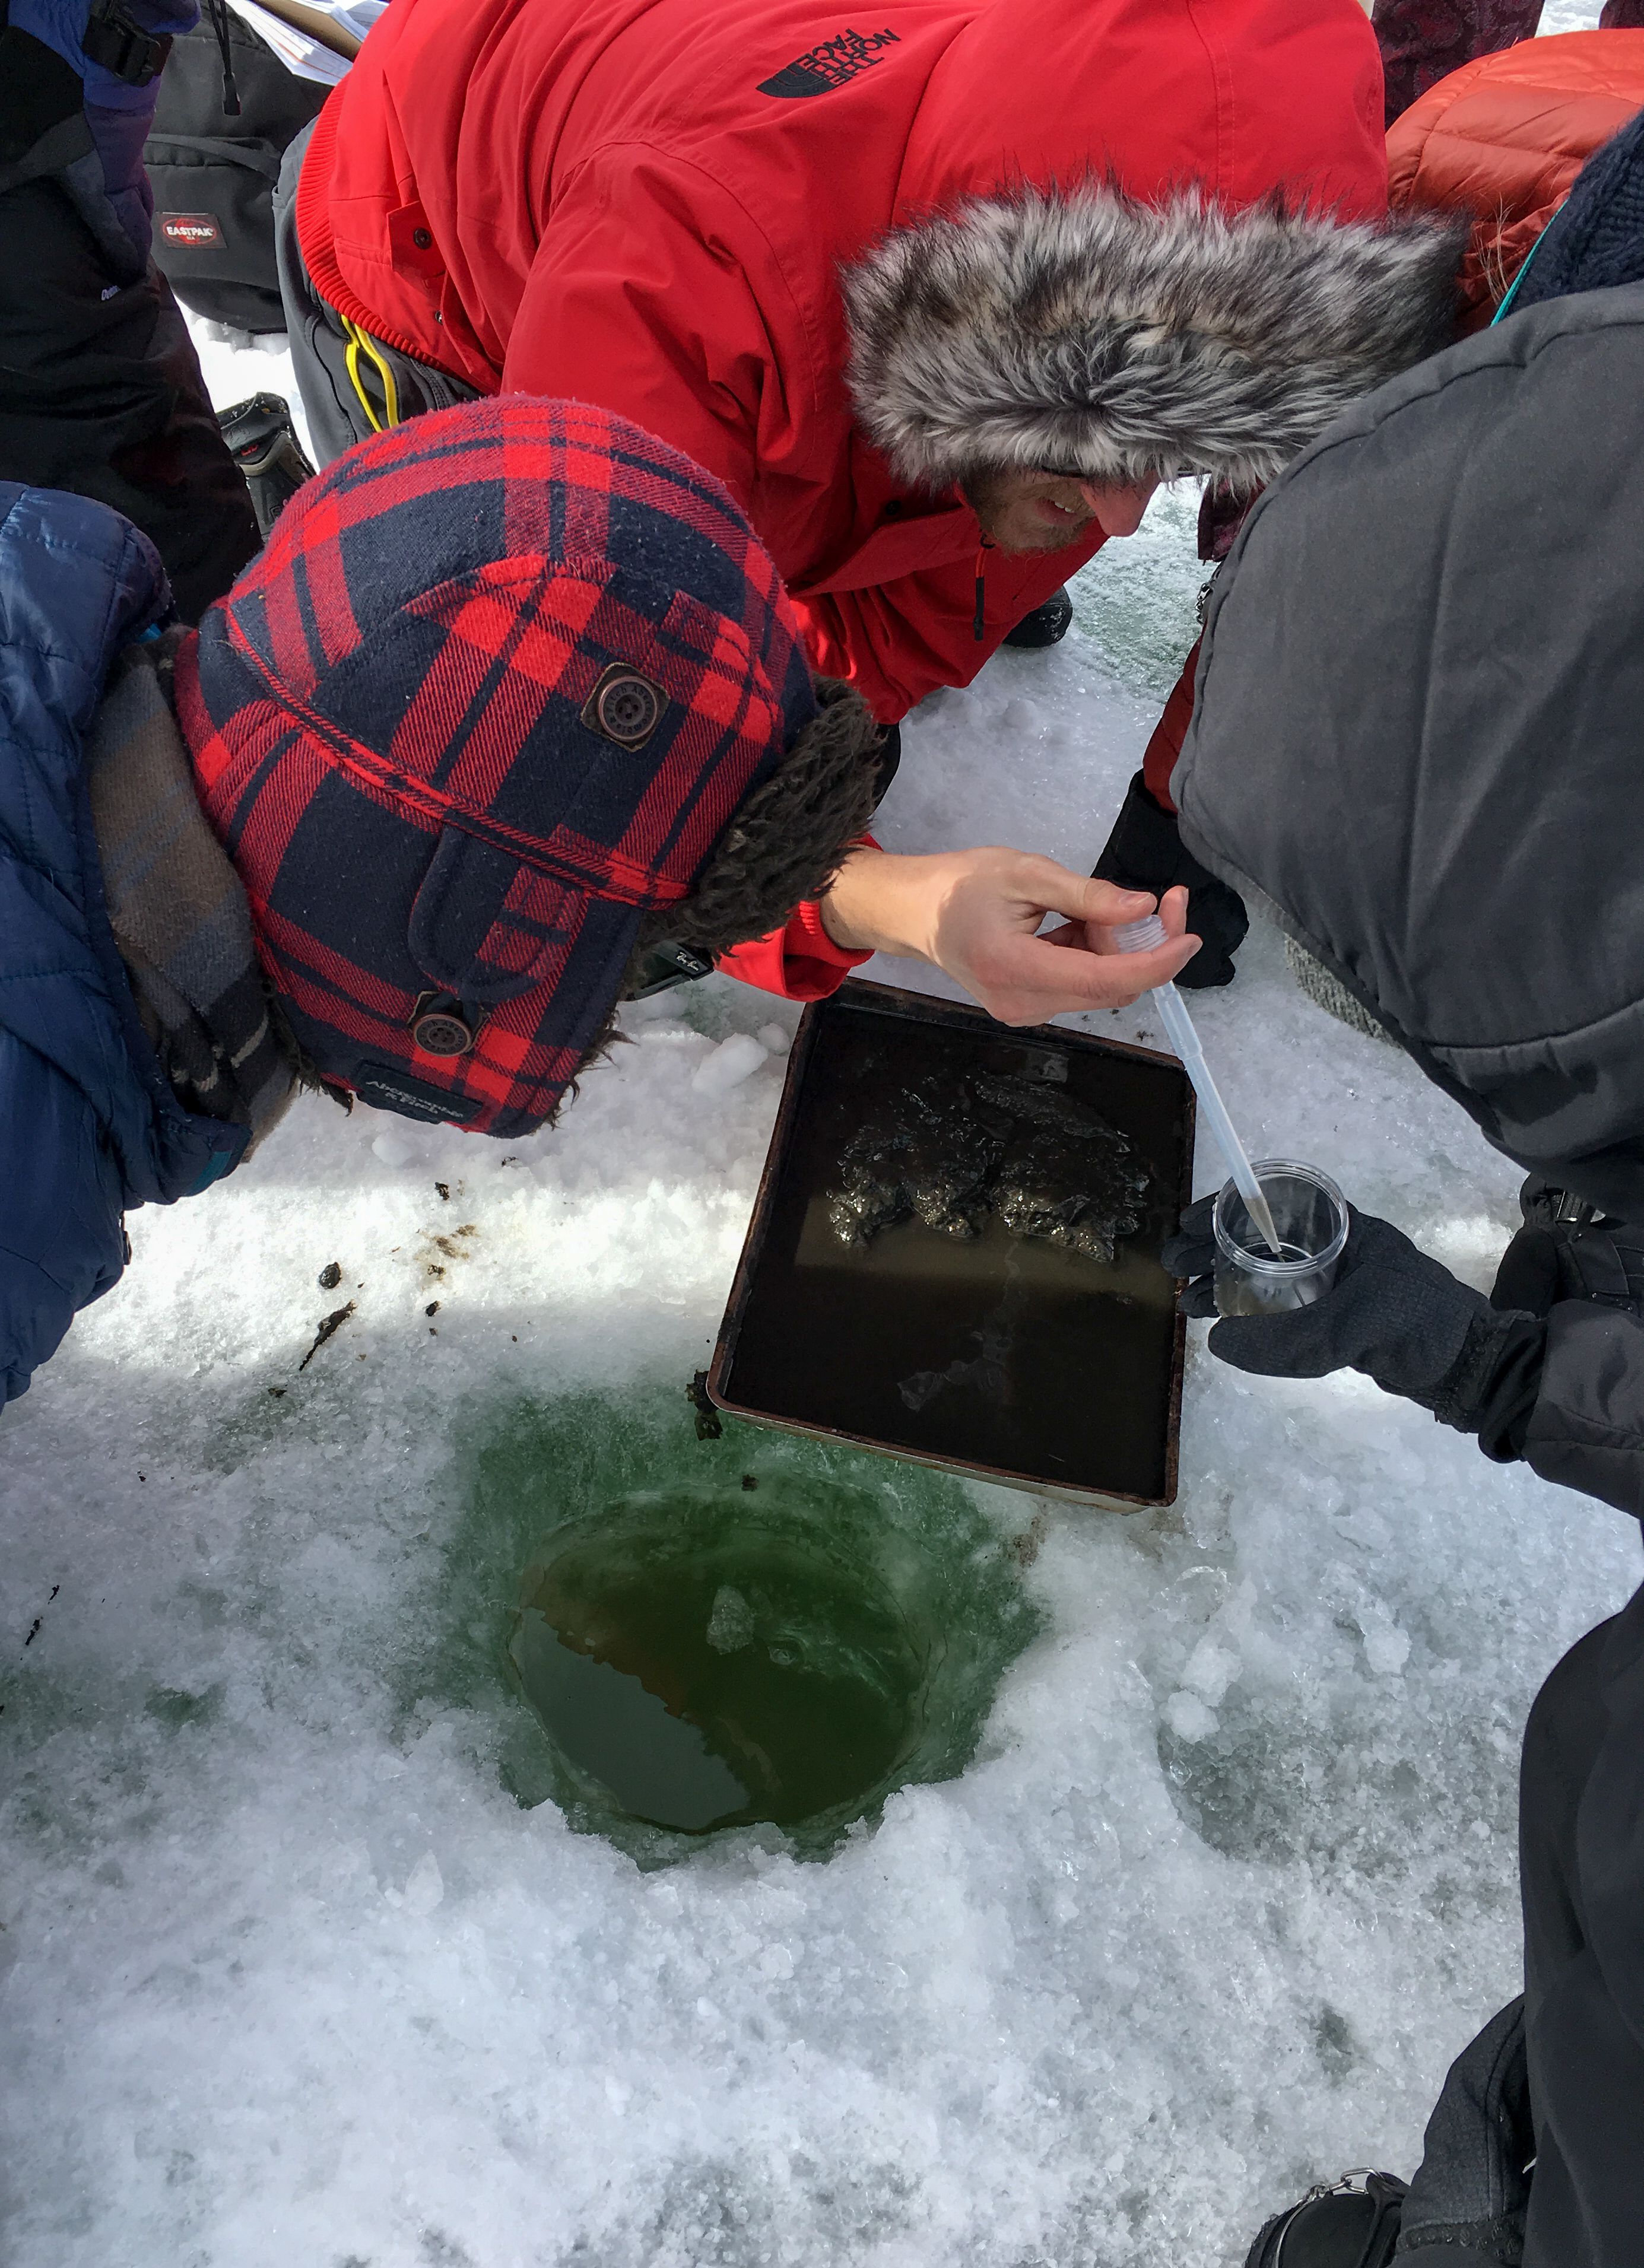
Sediment sampling for benthic arthropods
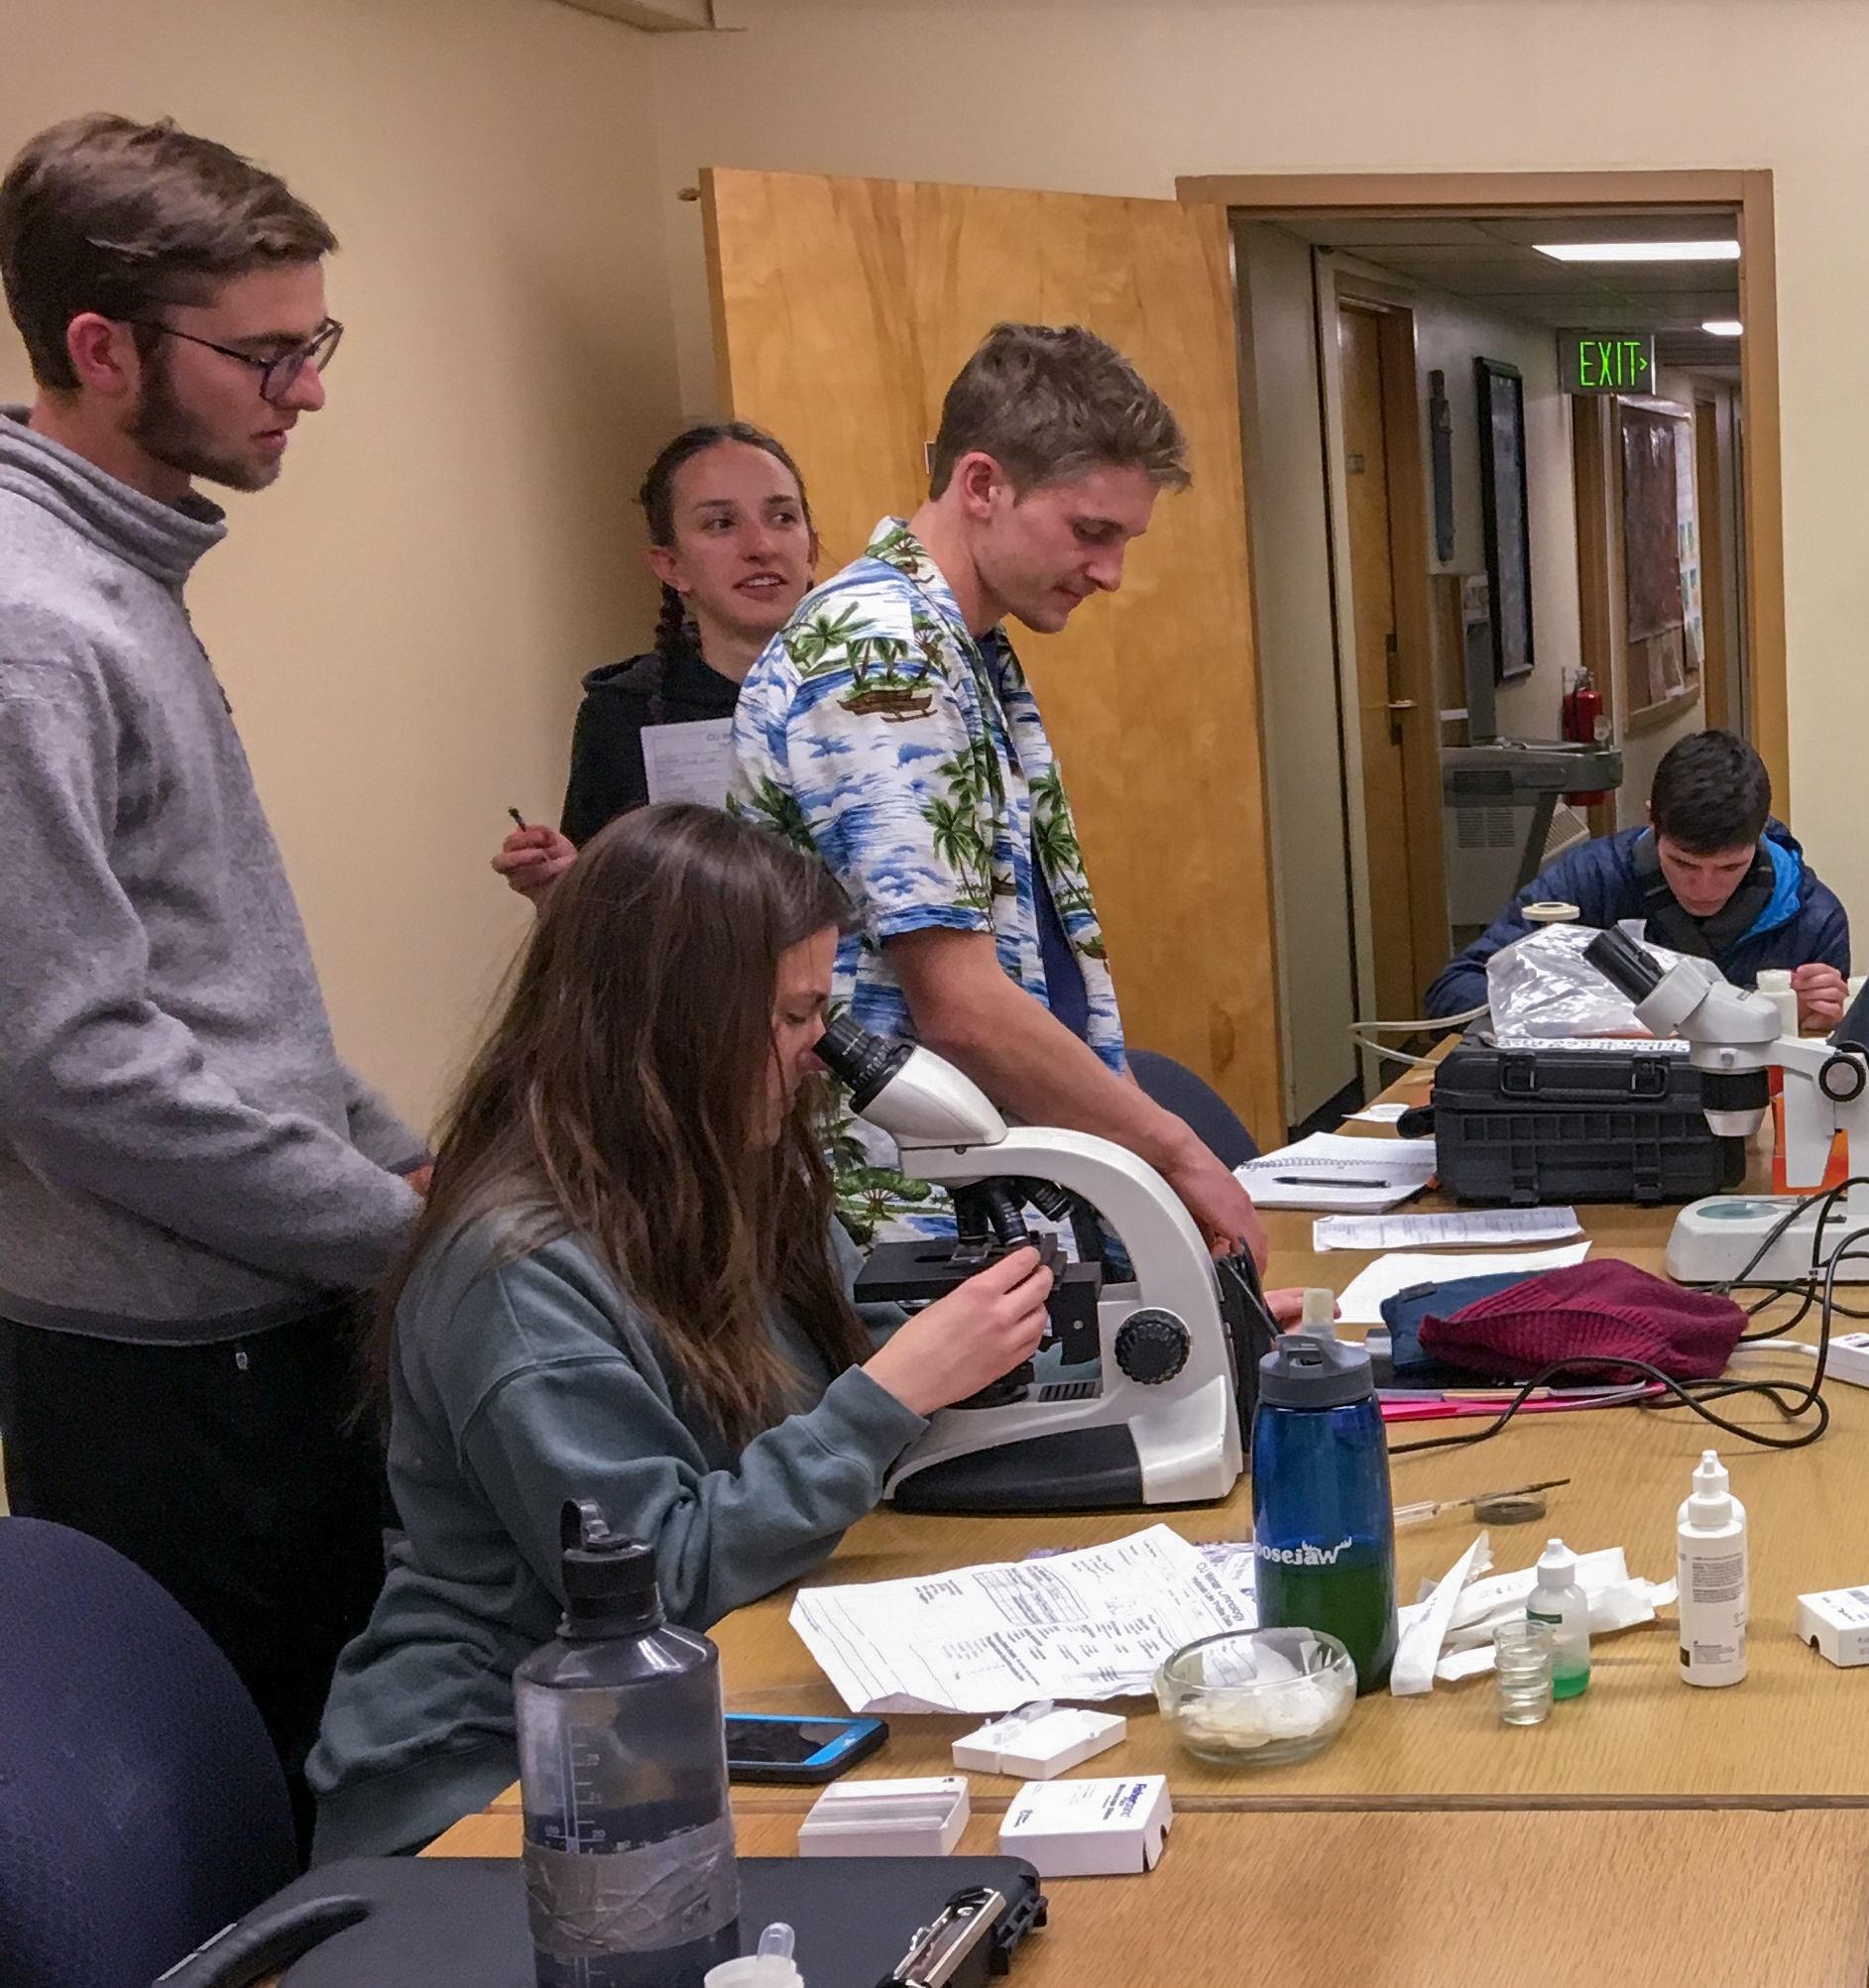
Phytoplankton & invertebrate lab work
|
|
Previous years
|
|
2018
|
2/3/18 Gold Lake -
- Profiles: Sonde & Microbes (Blackboard
image)
- Sonde readings only to ~0.5m of sediment surface
(sonde was missing cage to protect sensors)
- Lake partly snow-covered (see photo above)
- Ice thickness 22 cm
- Seechi disk depth = 2.7m (~10% surface light)
- Datasheet (pdf,
500k)
|
Click images to enlarge
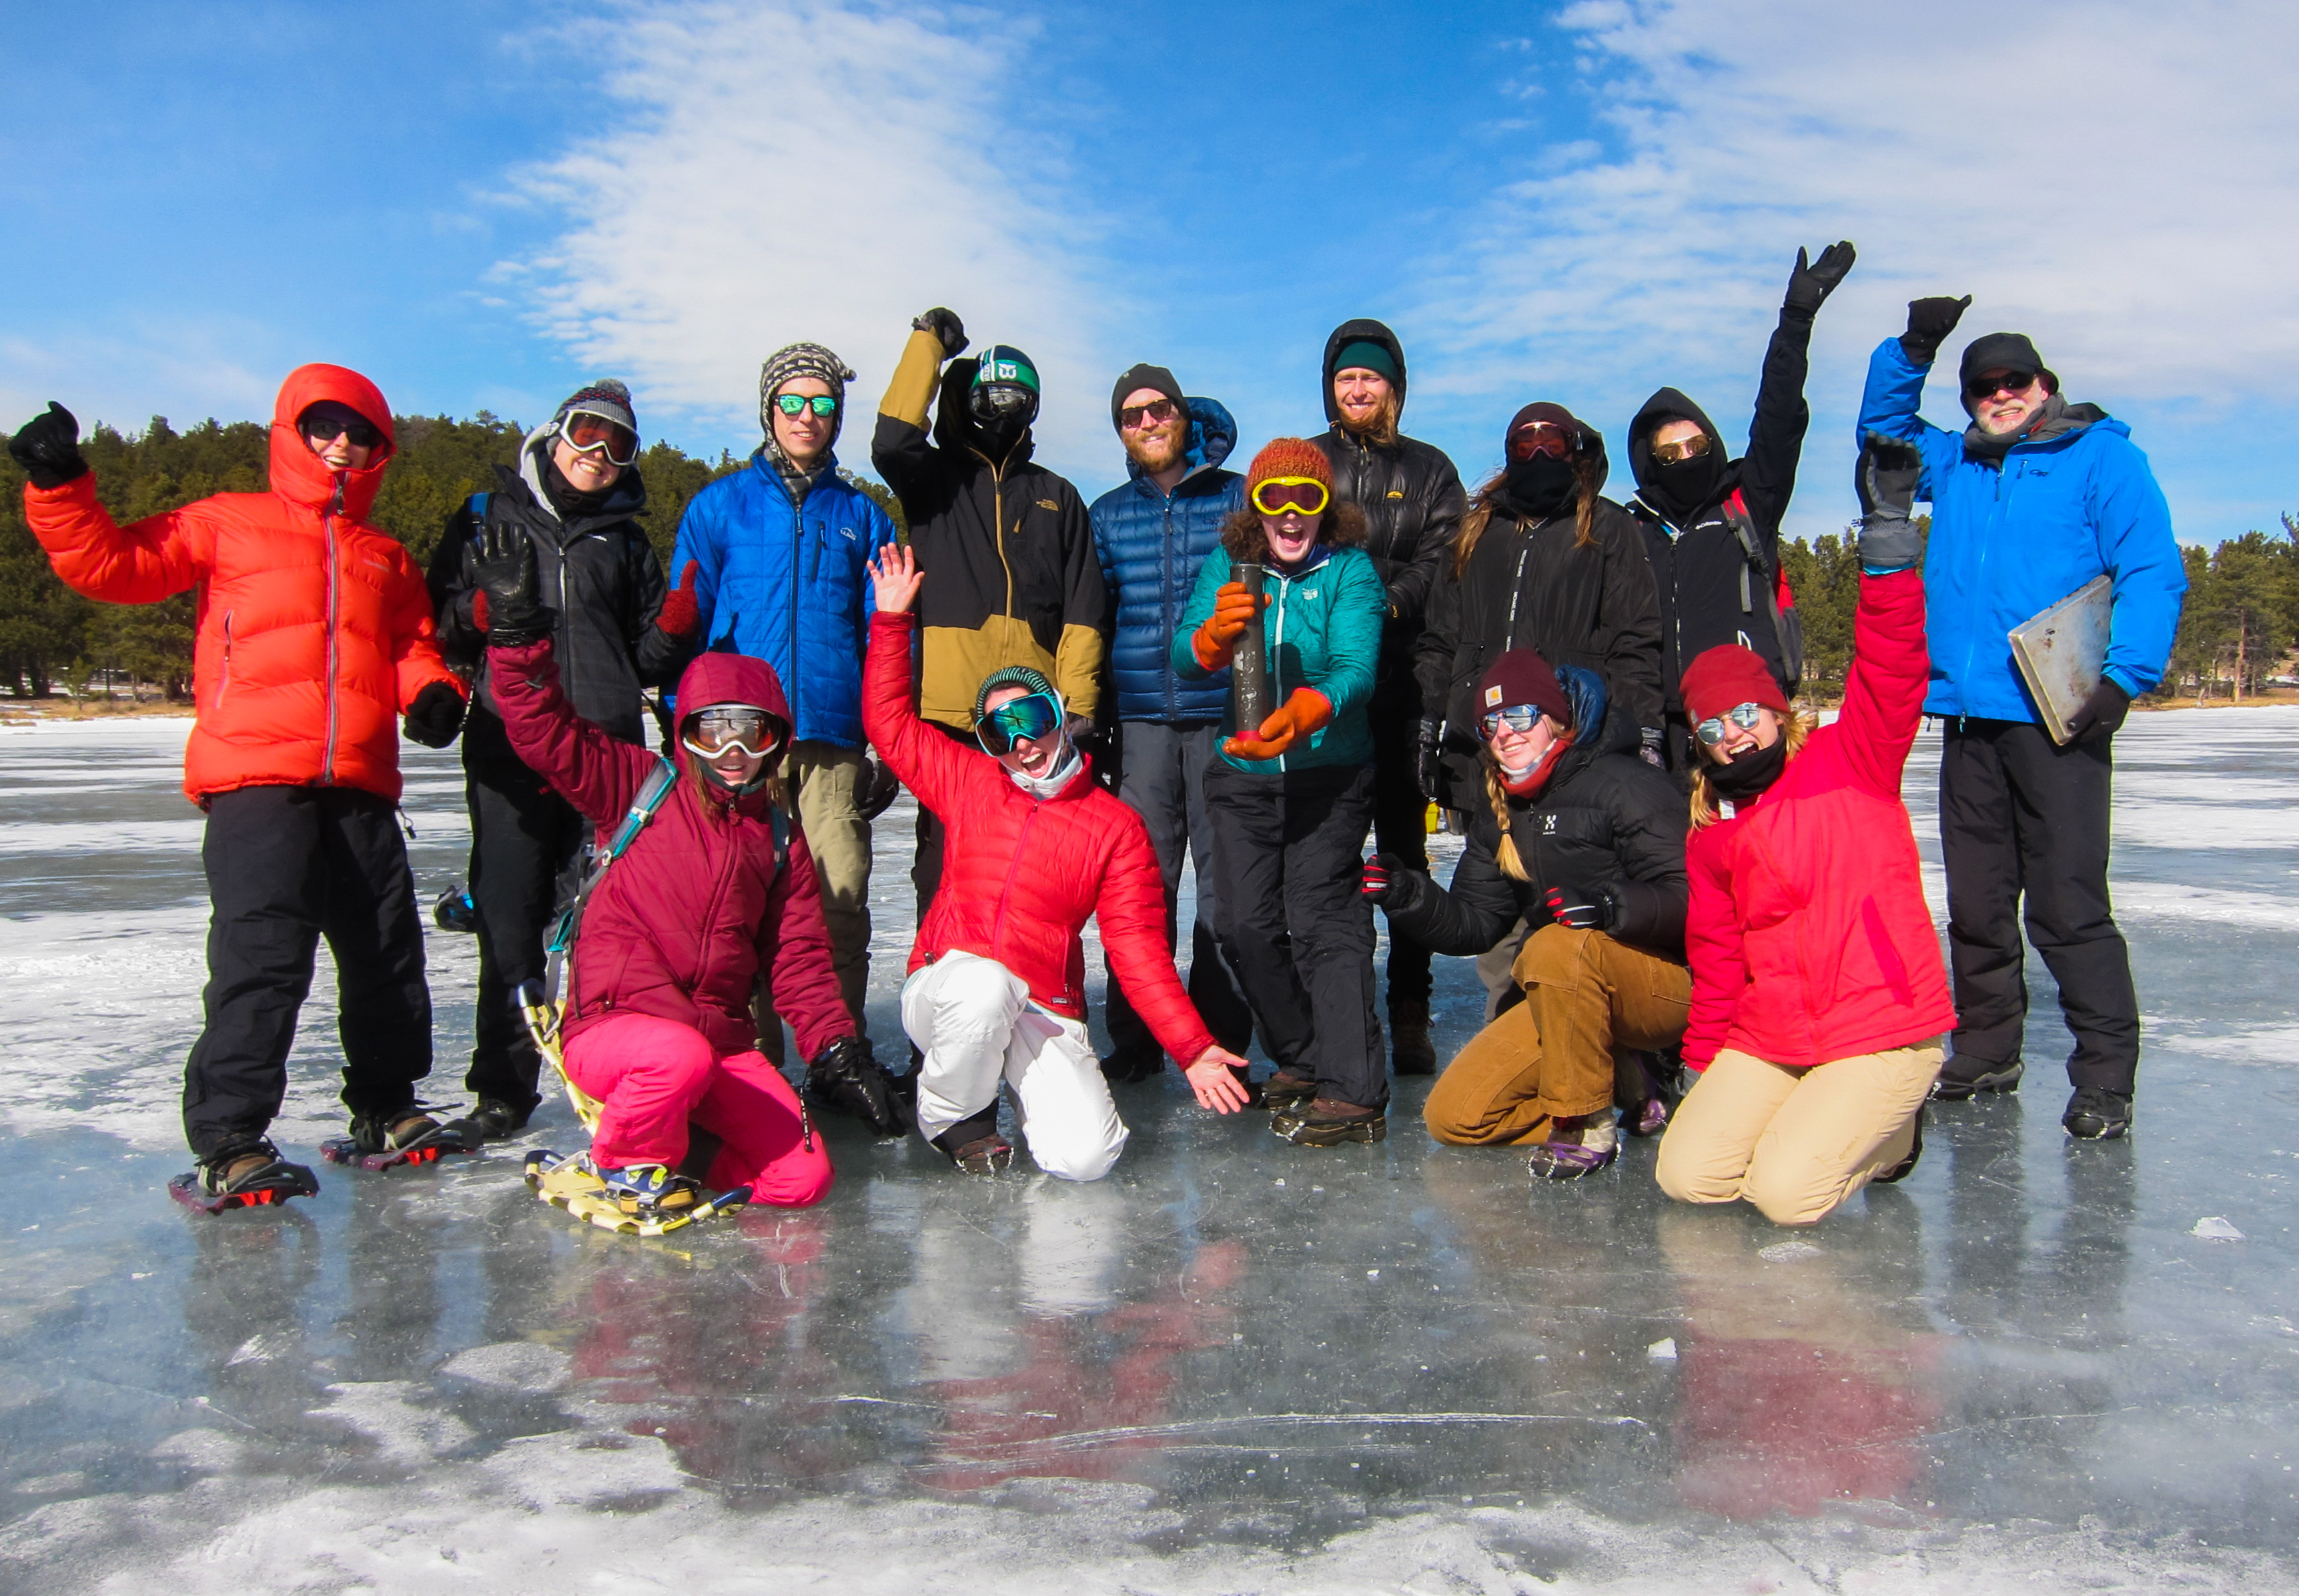
Class on Gold Lake
photo (c)S.Spaulding
Following photos (c) T
Kittel
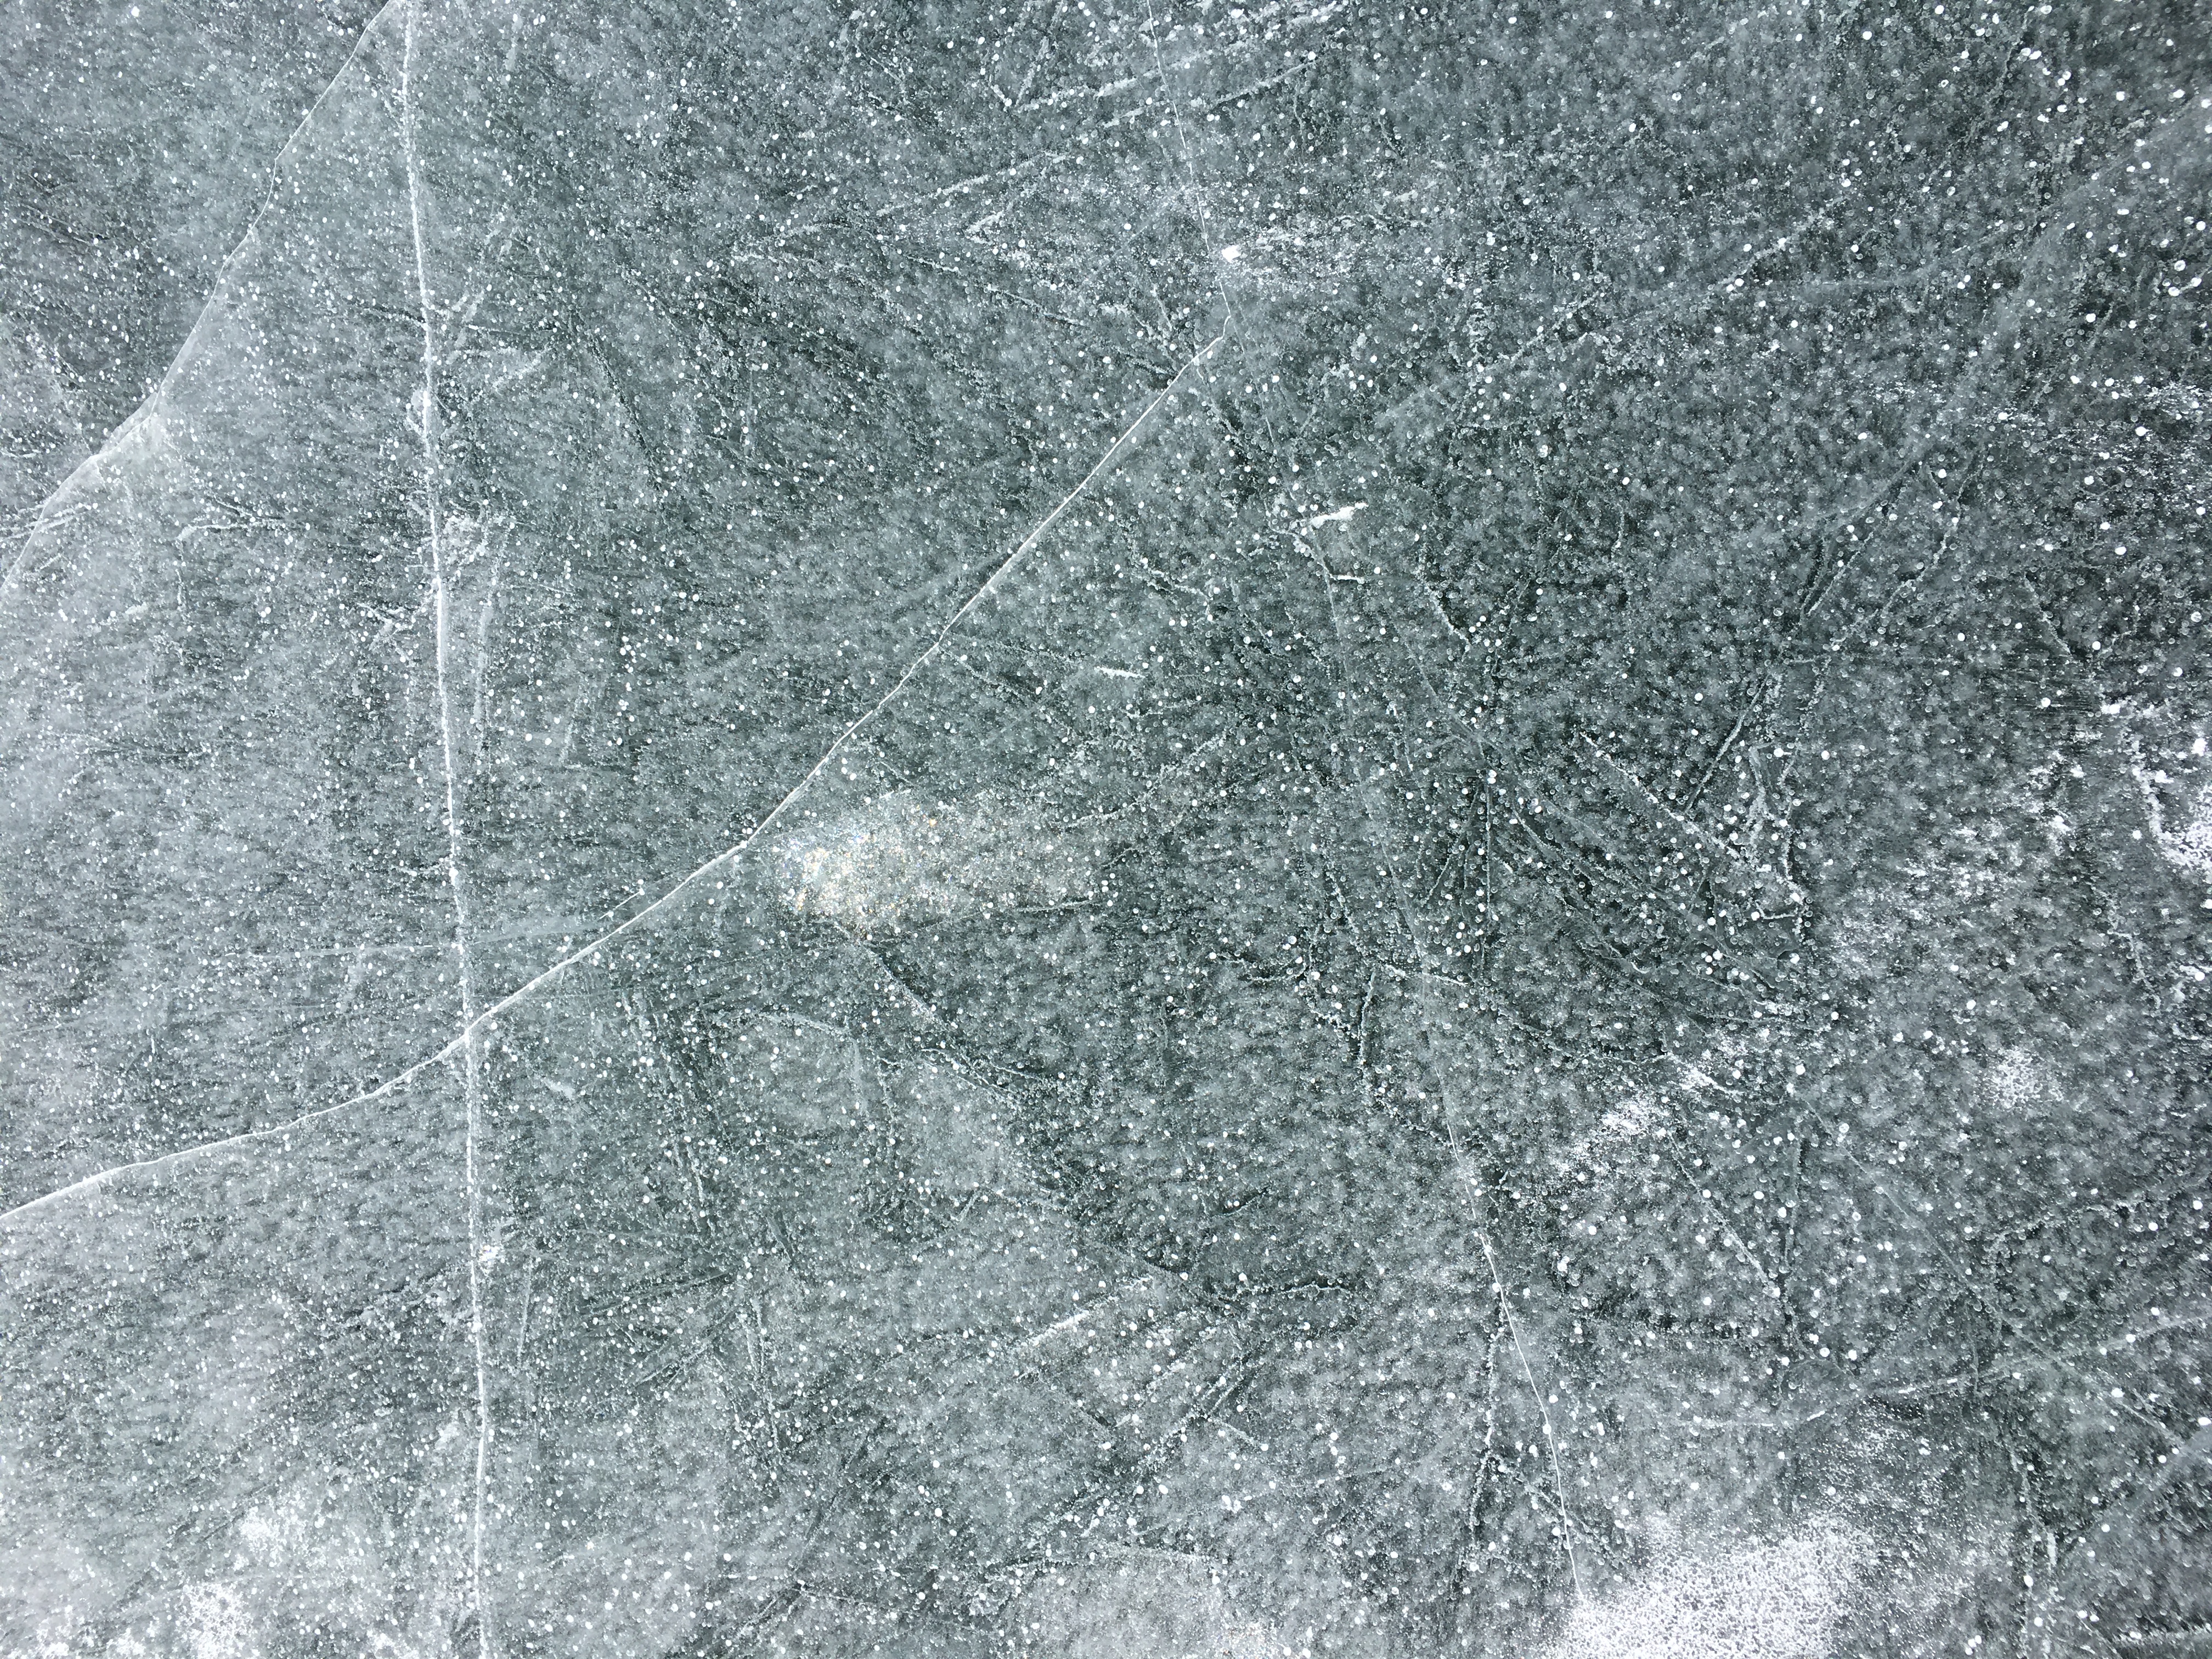
Ice Surface

Segmenting the Sediment Core
|
2017
|
2/11/17 Gold Lake -
- Profiles: Sonde & Microbes (Blackboard)
- Vertical profile sampled in shallow water because
of thin ice - max depth 1.75m
- Seechi depth = 1.45m. At an additional hole,
Seechi = 2.25m
- Ice thickness 33cm
- Datasheet (pdf,
800k)
- Cyanobacteria important throughout profile
 T and pH profile dotted lines below 1.75m
and %DO profiles are hypothesized based on
previous years' results
|
|
2016
|
2/6/16 Gold Lake -
- Profiles: Sonde & Microbes
(Blackboard)
- % Dissolved Oxygen data from 2011 (not measured by
this sonde) -- see 2013 & 2014 results to
see variation.
- Lake entirely snow-covered (see photo to left)
- Ice thickness 31-32 cm
Click images to enlarge
- Profiles: Filters
- Color (i.e. phytoplankton concentrations)
strongest in 2 & 4 meter depth samples
- Color = blue-green, corresponding to high
presence of cyanobacteria observed in microscope
work
- Zooplankton present at all 4 depths, most
numerous at 4 m, followed by 2 m
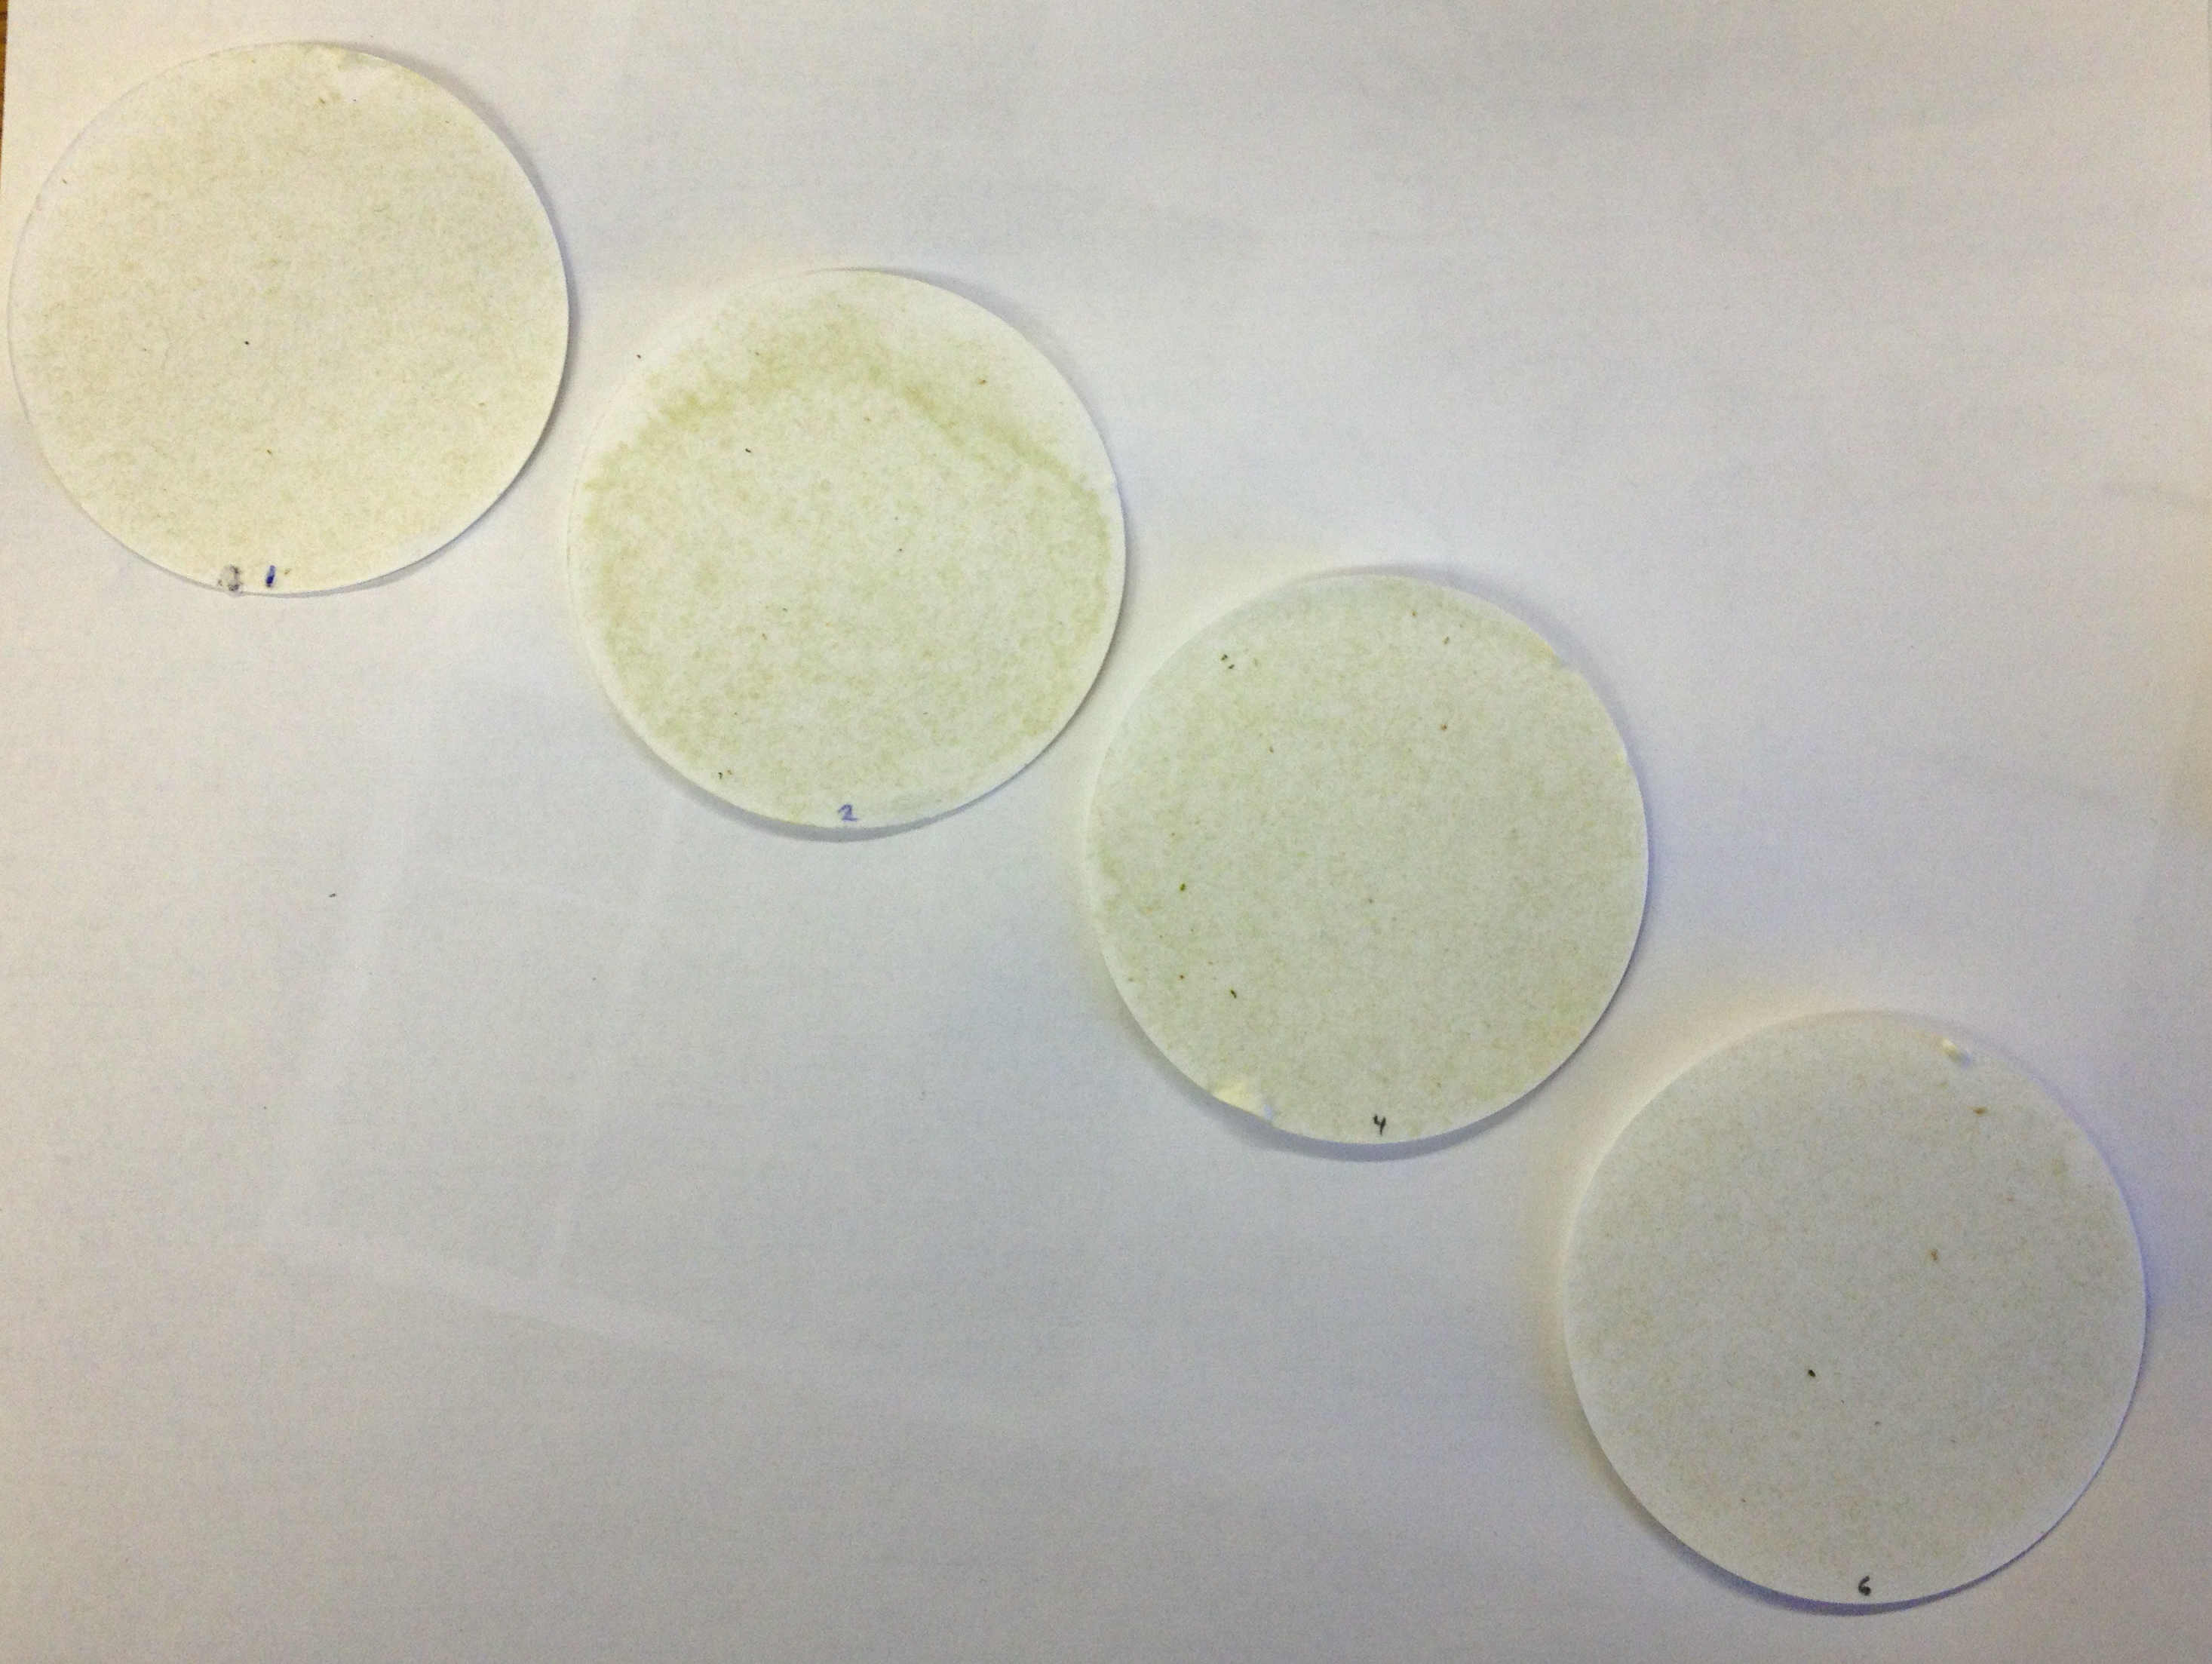
Filters from Left to Right are from 1, 2, 4, & 6
m depths
Sample = 1 gallon reduced to 105ml; from that 40ml
subsample filtered
|
Click images to enlarge
Photos
(c) Sarah Spaulding
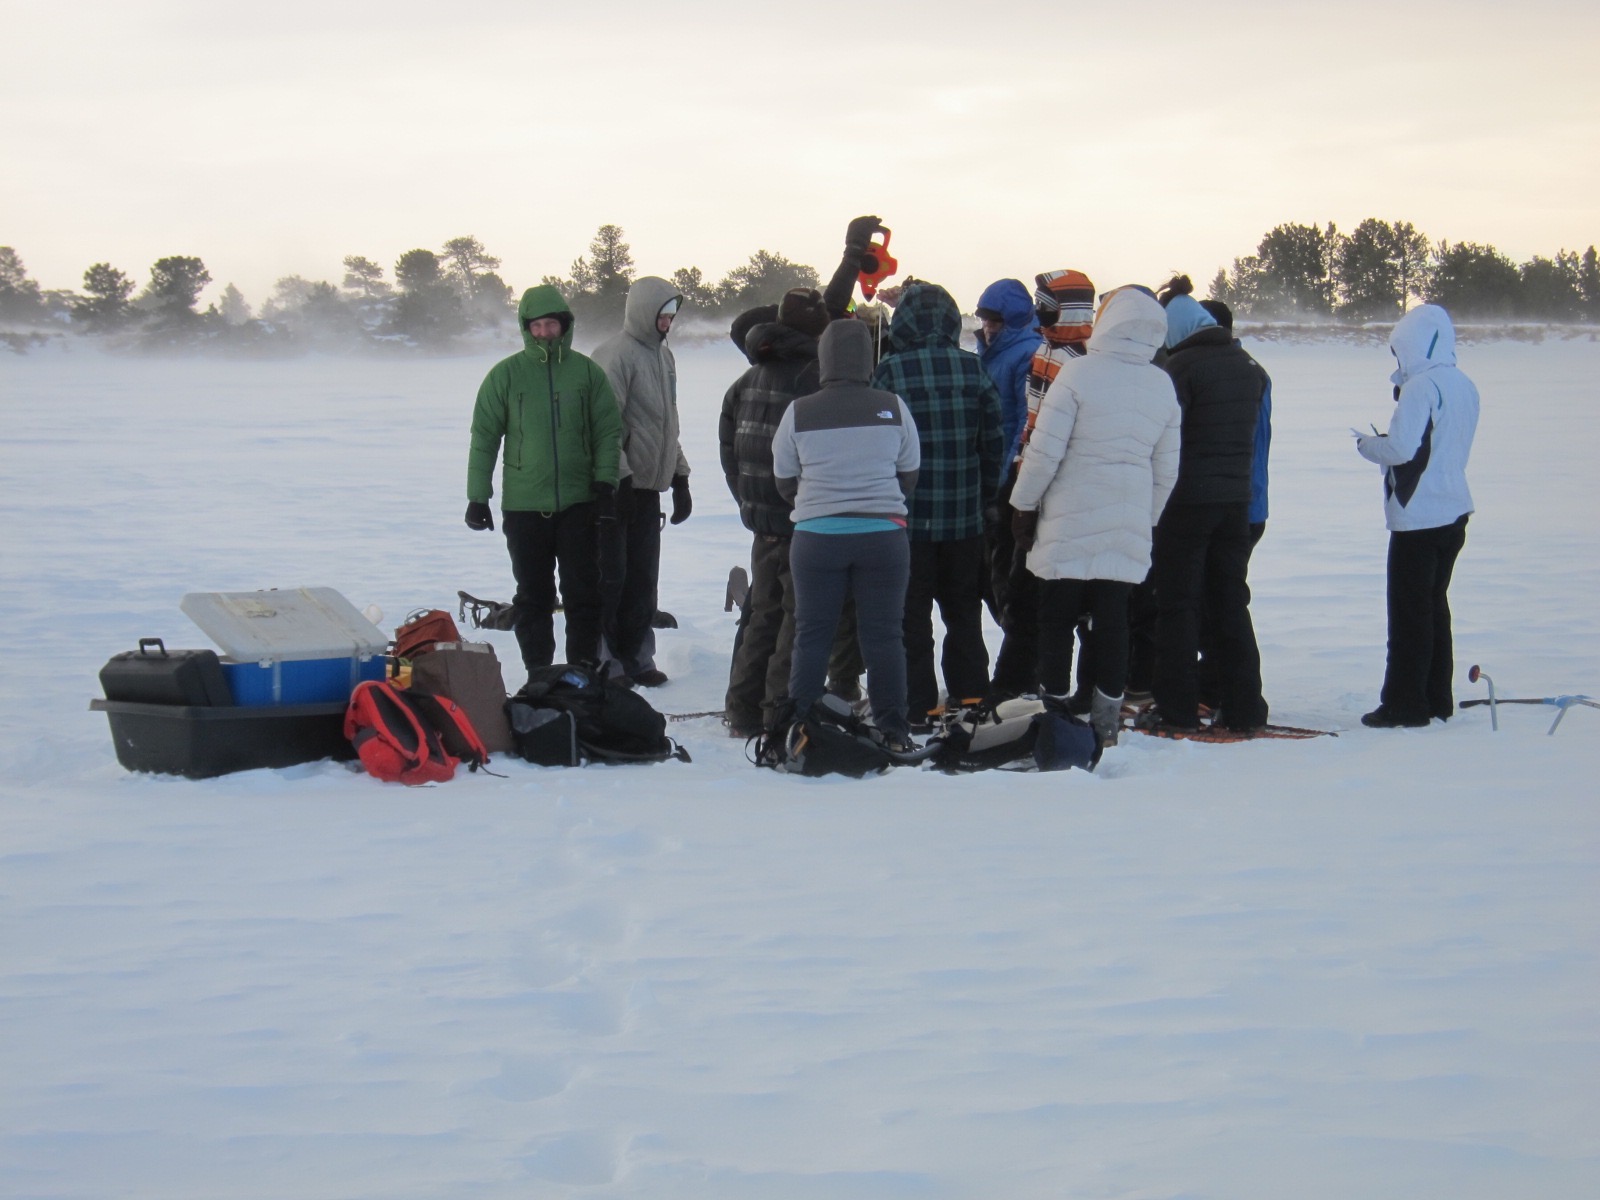 Mid-lake
measurements
 Inspecting
the hole in progress
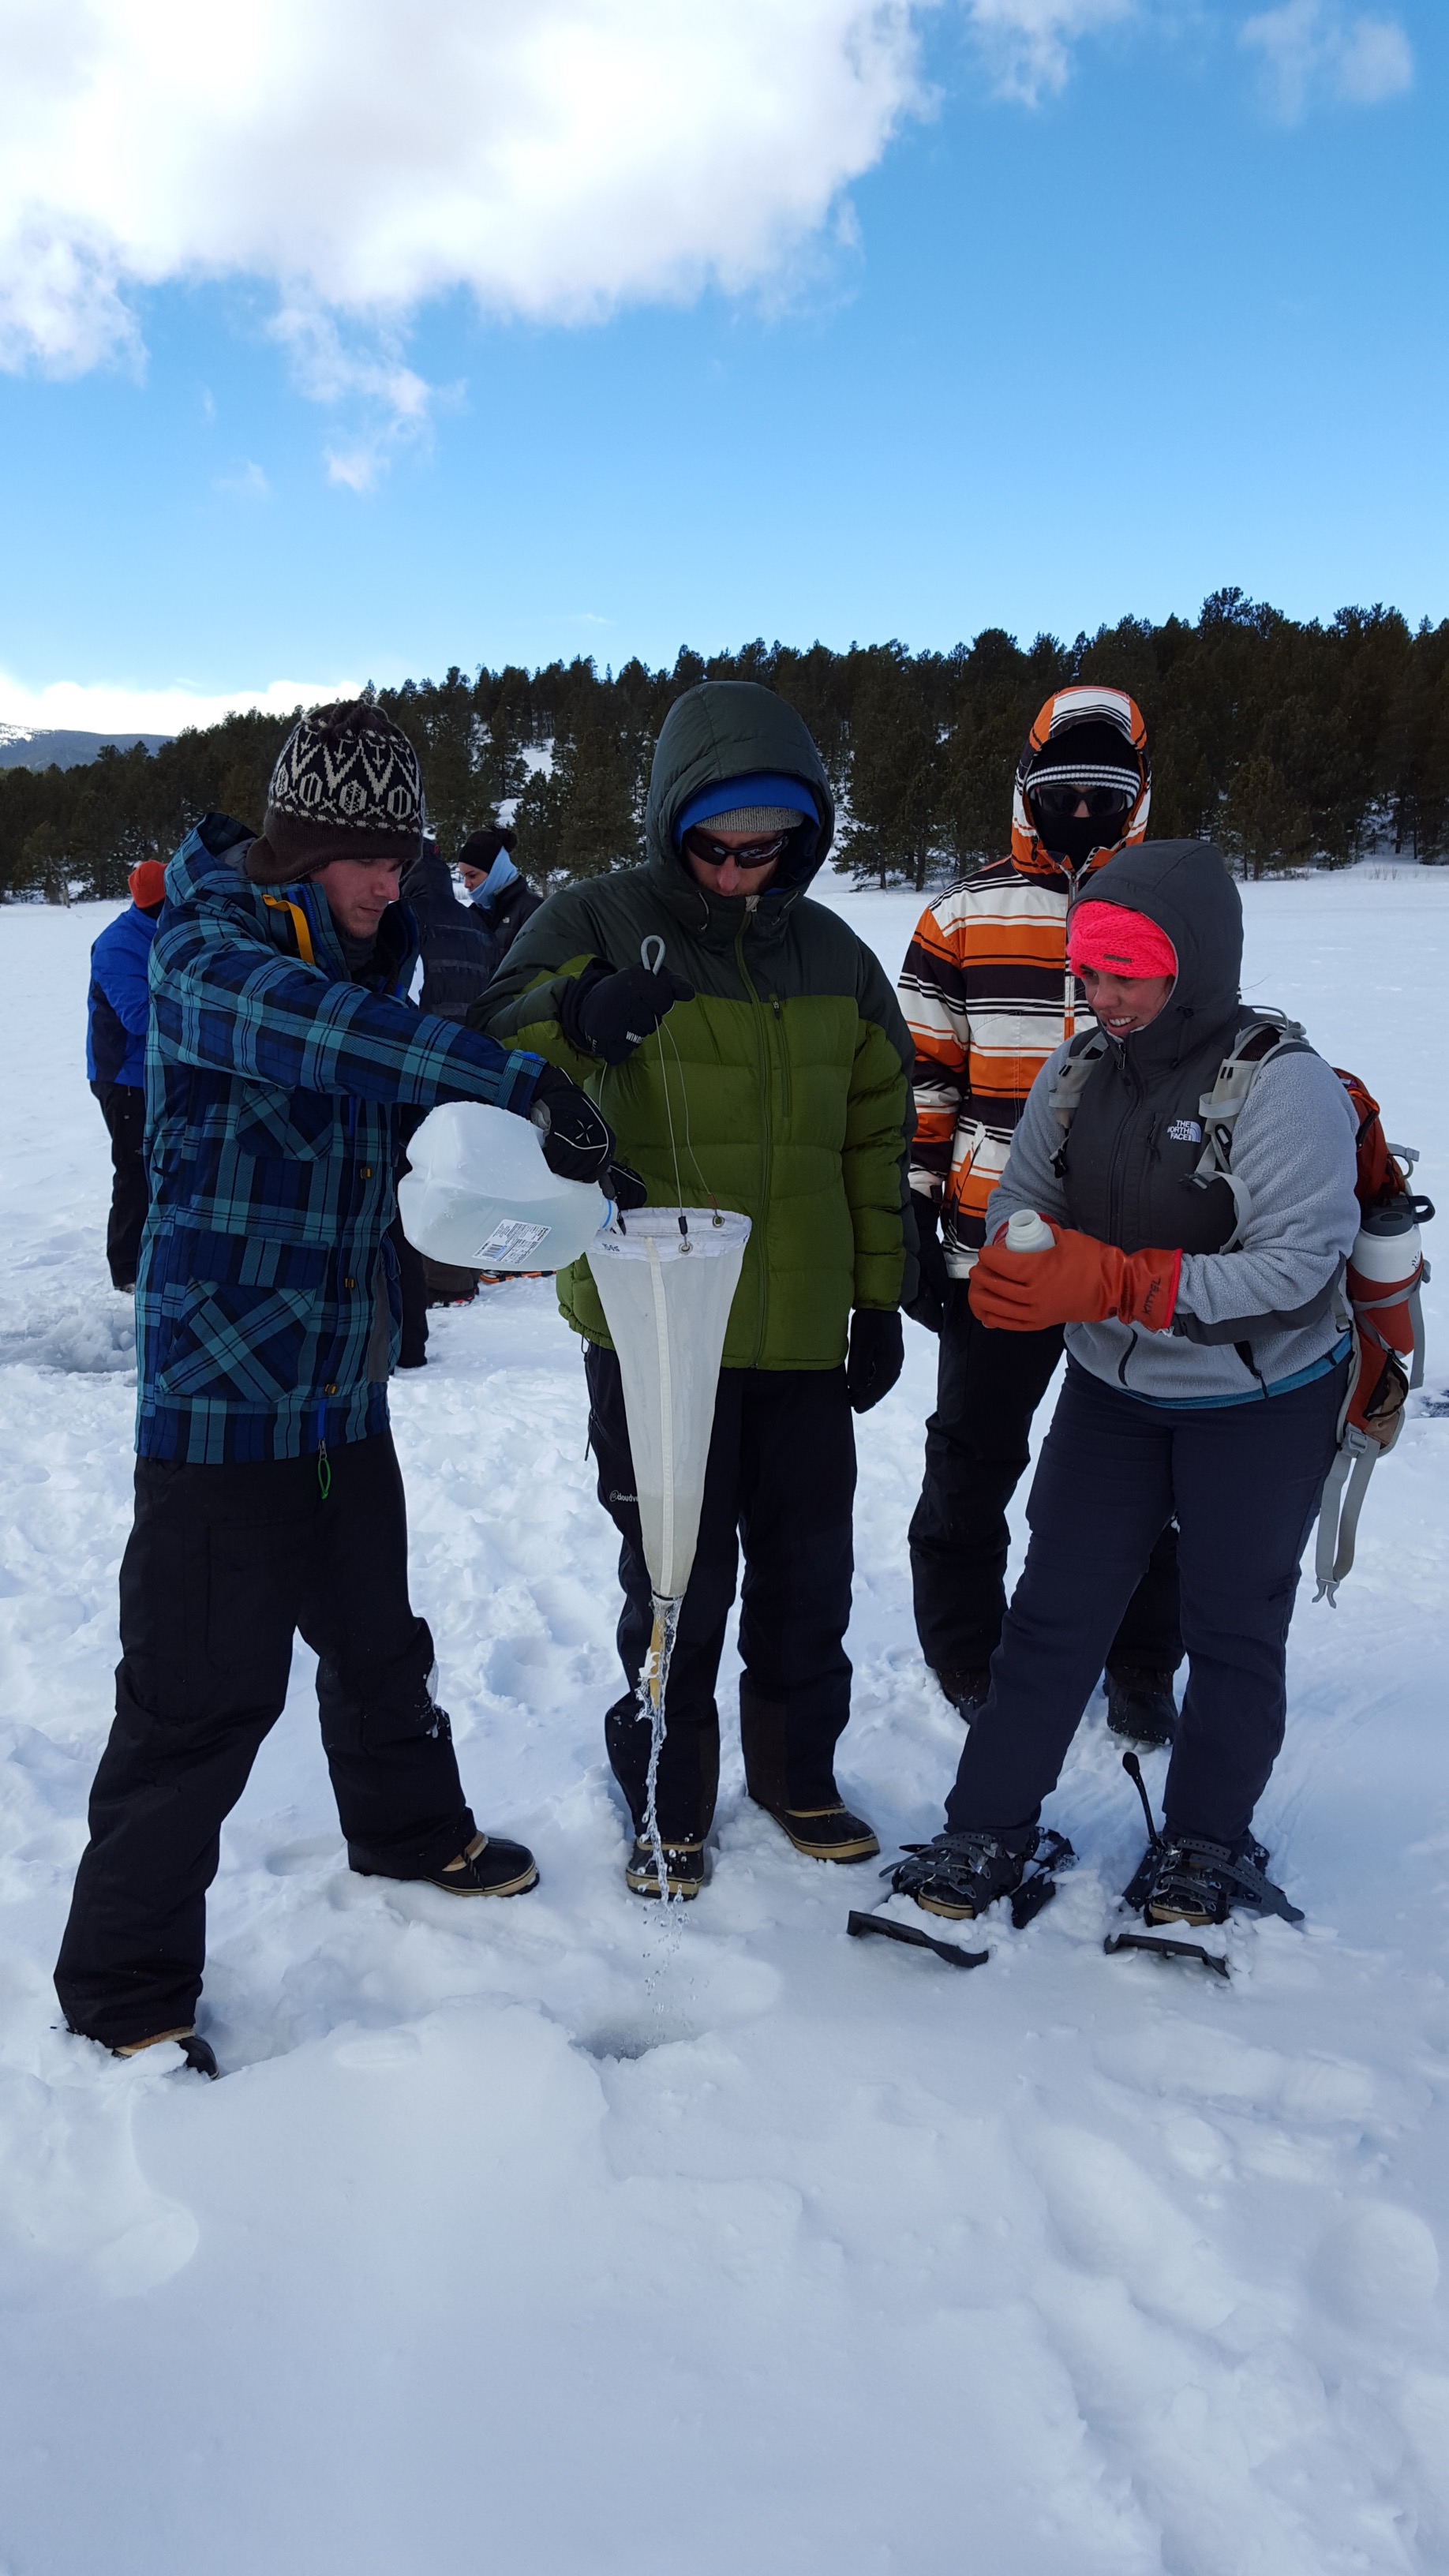 Filtering
sample for plankton
|
2015
|
1/31/15 Gold Lake -
3 Mid-lake measurement sites - click
to enlarge
Photo:
(c) T Kittel
- Datasheet (pdf, ) - pending
- Profiles: Hydrolab sonde & Microbes
(Blackboard)
- Sonde data at 0m were measured in situ.
Other profile values were from water samples,
measured in the lab a few hours later.
%DO below 4m were likely <100% and came to
equilibrium (~100%) by time measured in the lab.

Zooplankton present in all 3 filters
Note:Some sample lost during 3m filtering.
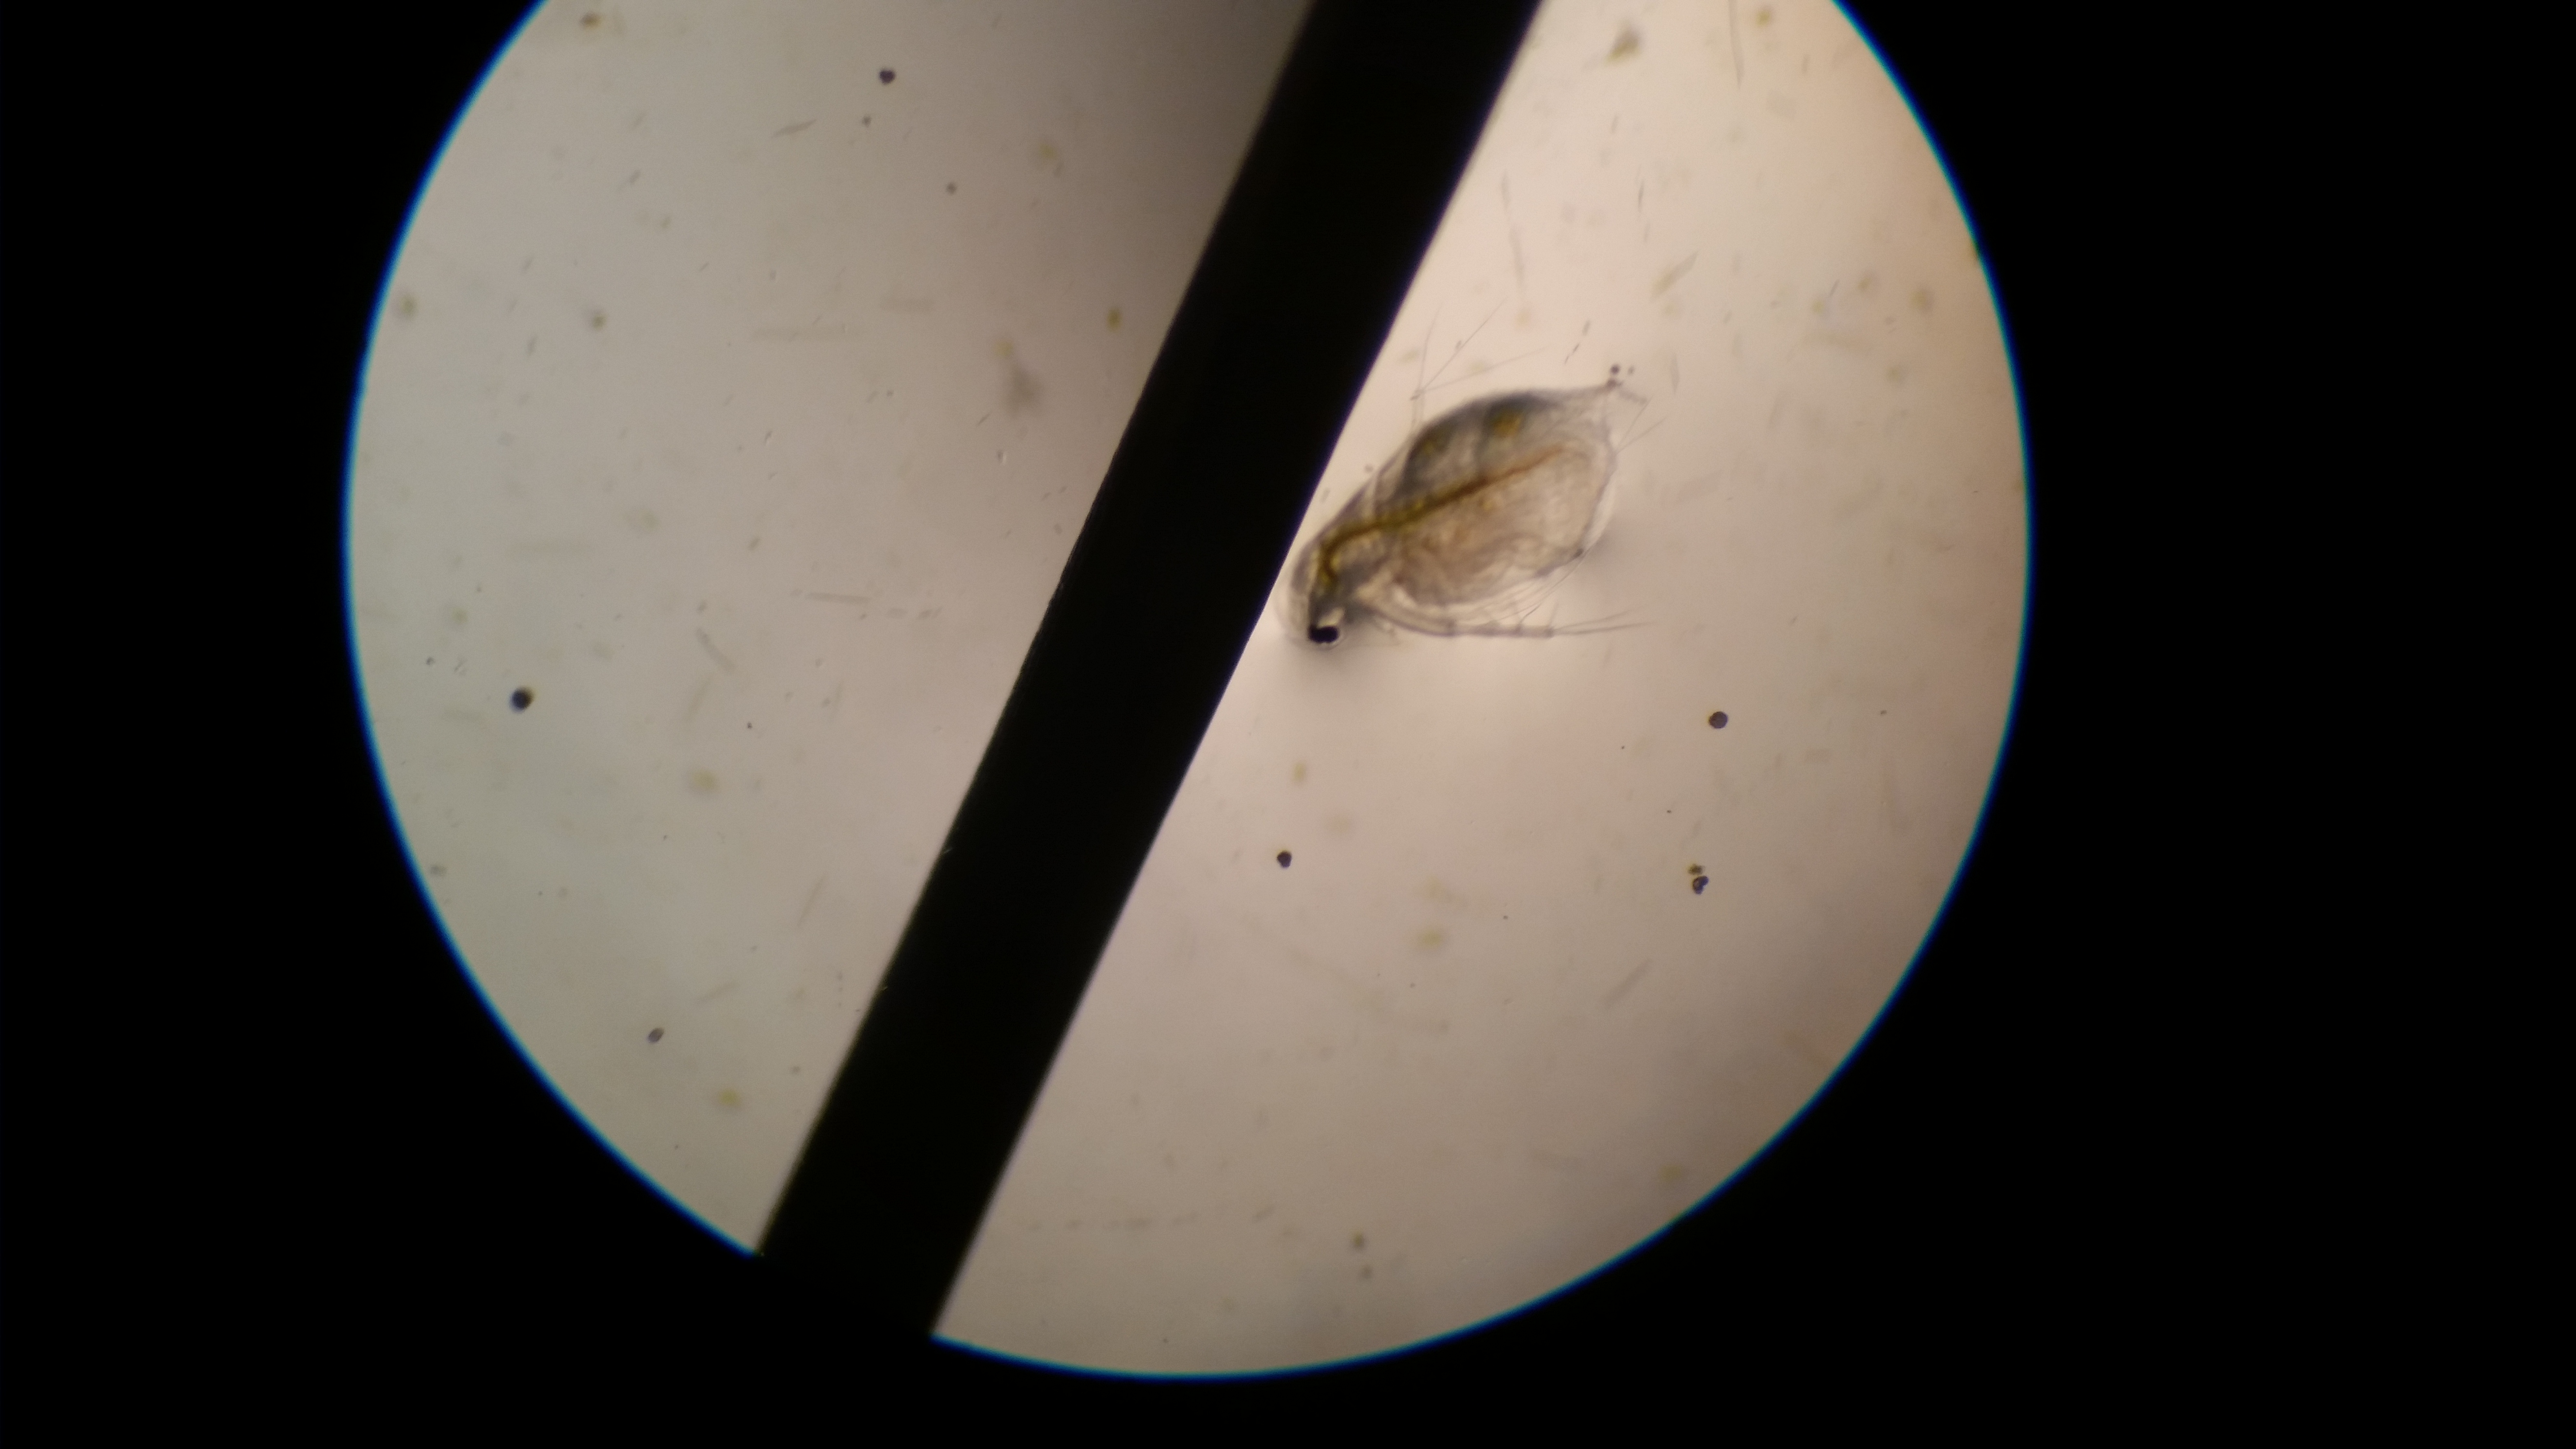
Daphne - photo (c) Jake DePompolo
|
Click images to
enlarge:
Photos:
(c) Sarah Spaulding
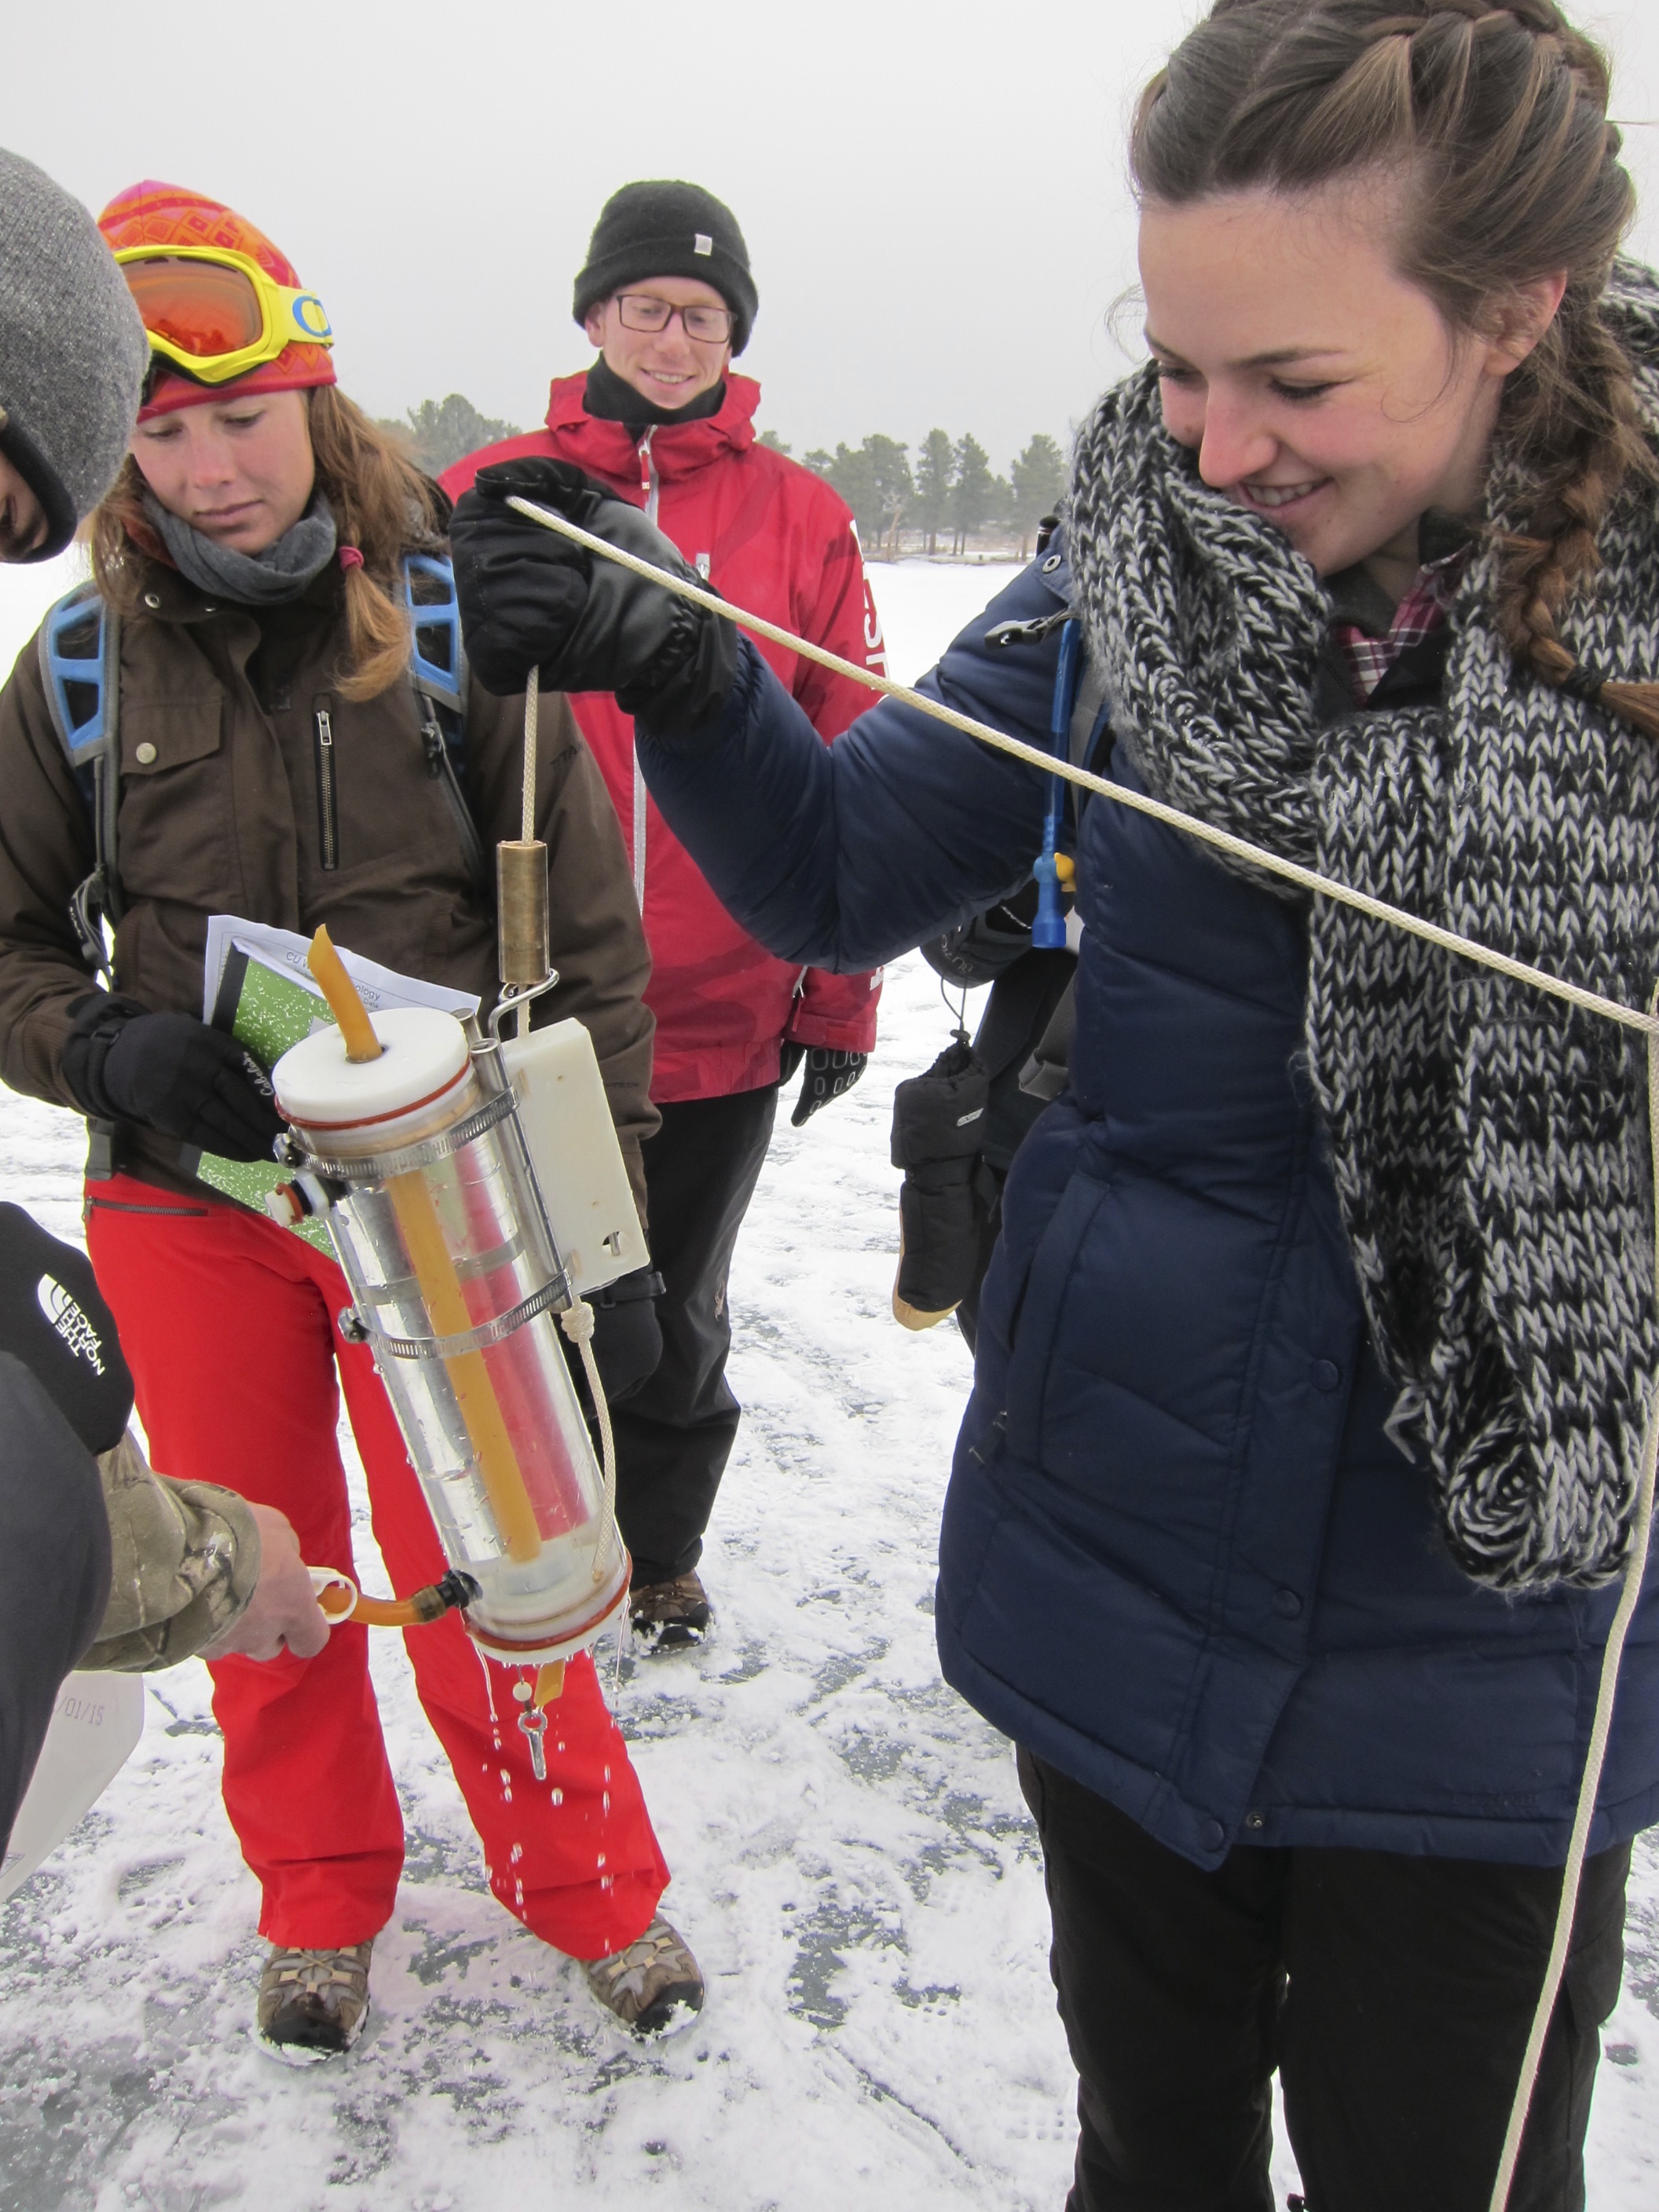
Water column sampling with Van Dorn bottle

Filtering phyto- & zooplankton sample

Sediment sample
|
2014
|
2/09/14 Gold Lake -
- Ice thickness = 17" (43cm), snowcover = 10cm.
Overcast, snowing from divide, breezy (NW), air T =
-1.1C.
- Datasheet (pdf,
2M)
- Profiles: Hydrolab sonde & Microbes
(Blackboard)
|
Click
images to enlarge -
Also featured on
INSTAAR's website: http://instaar.colorado.edu/galleries/winter-ecology-class-field-day/
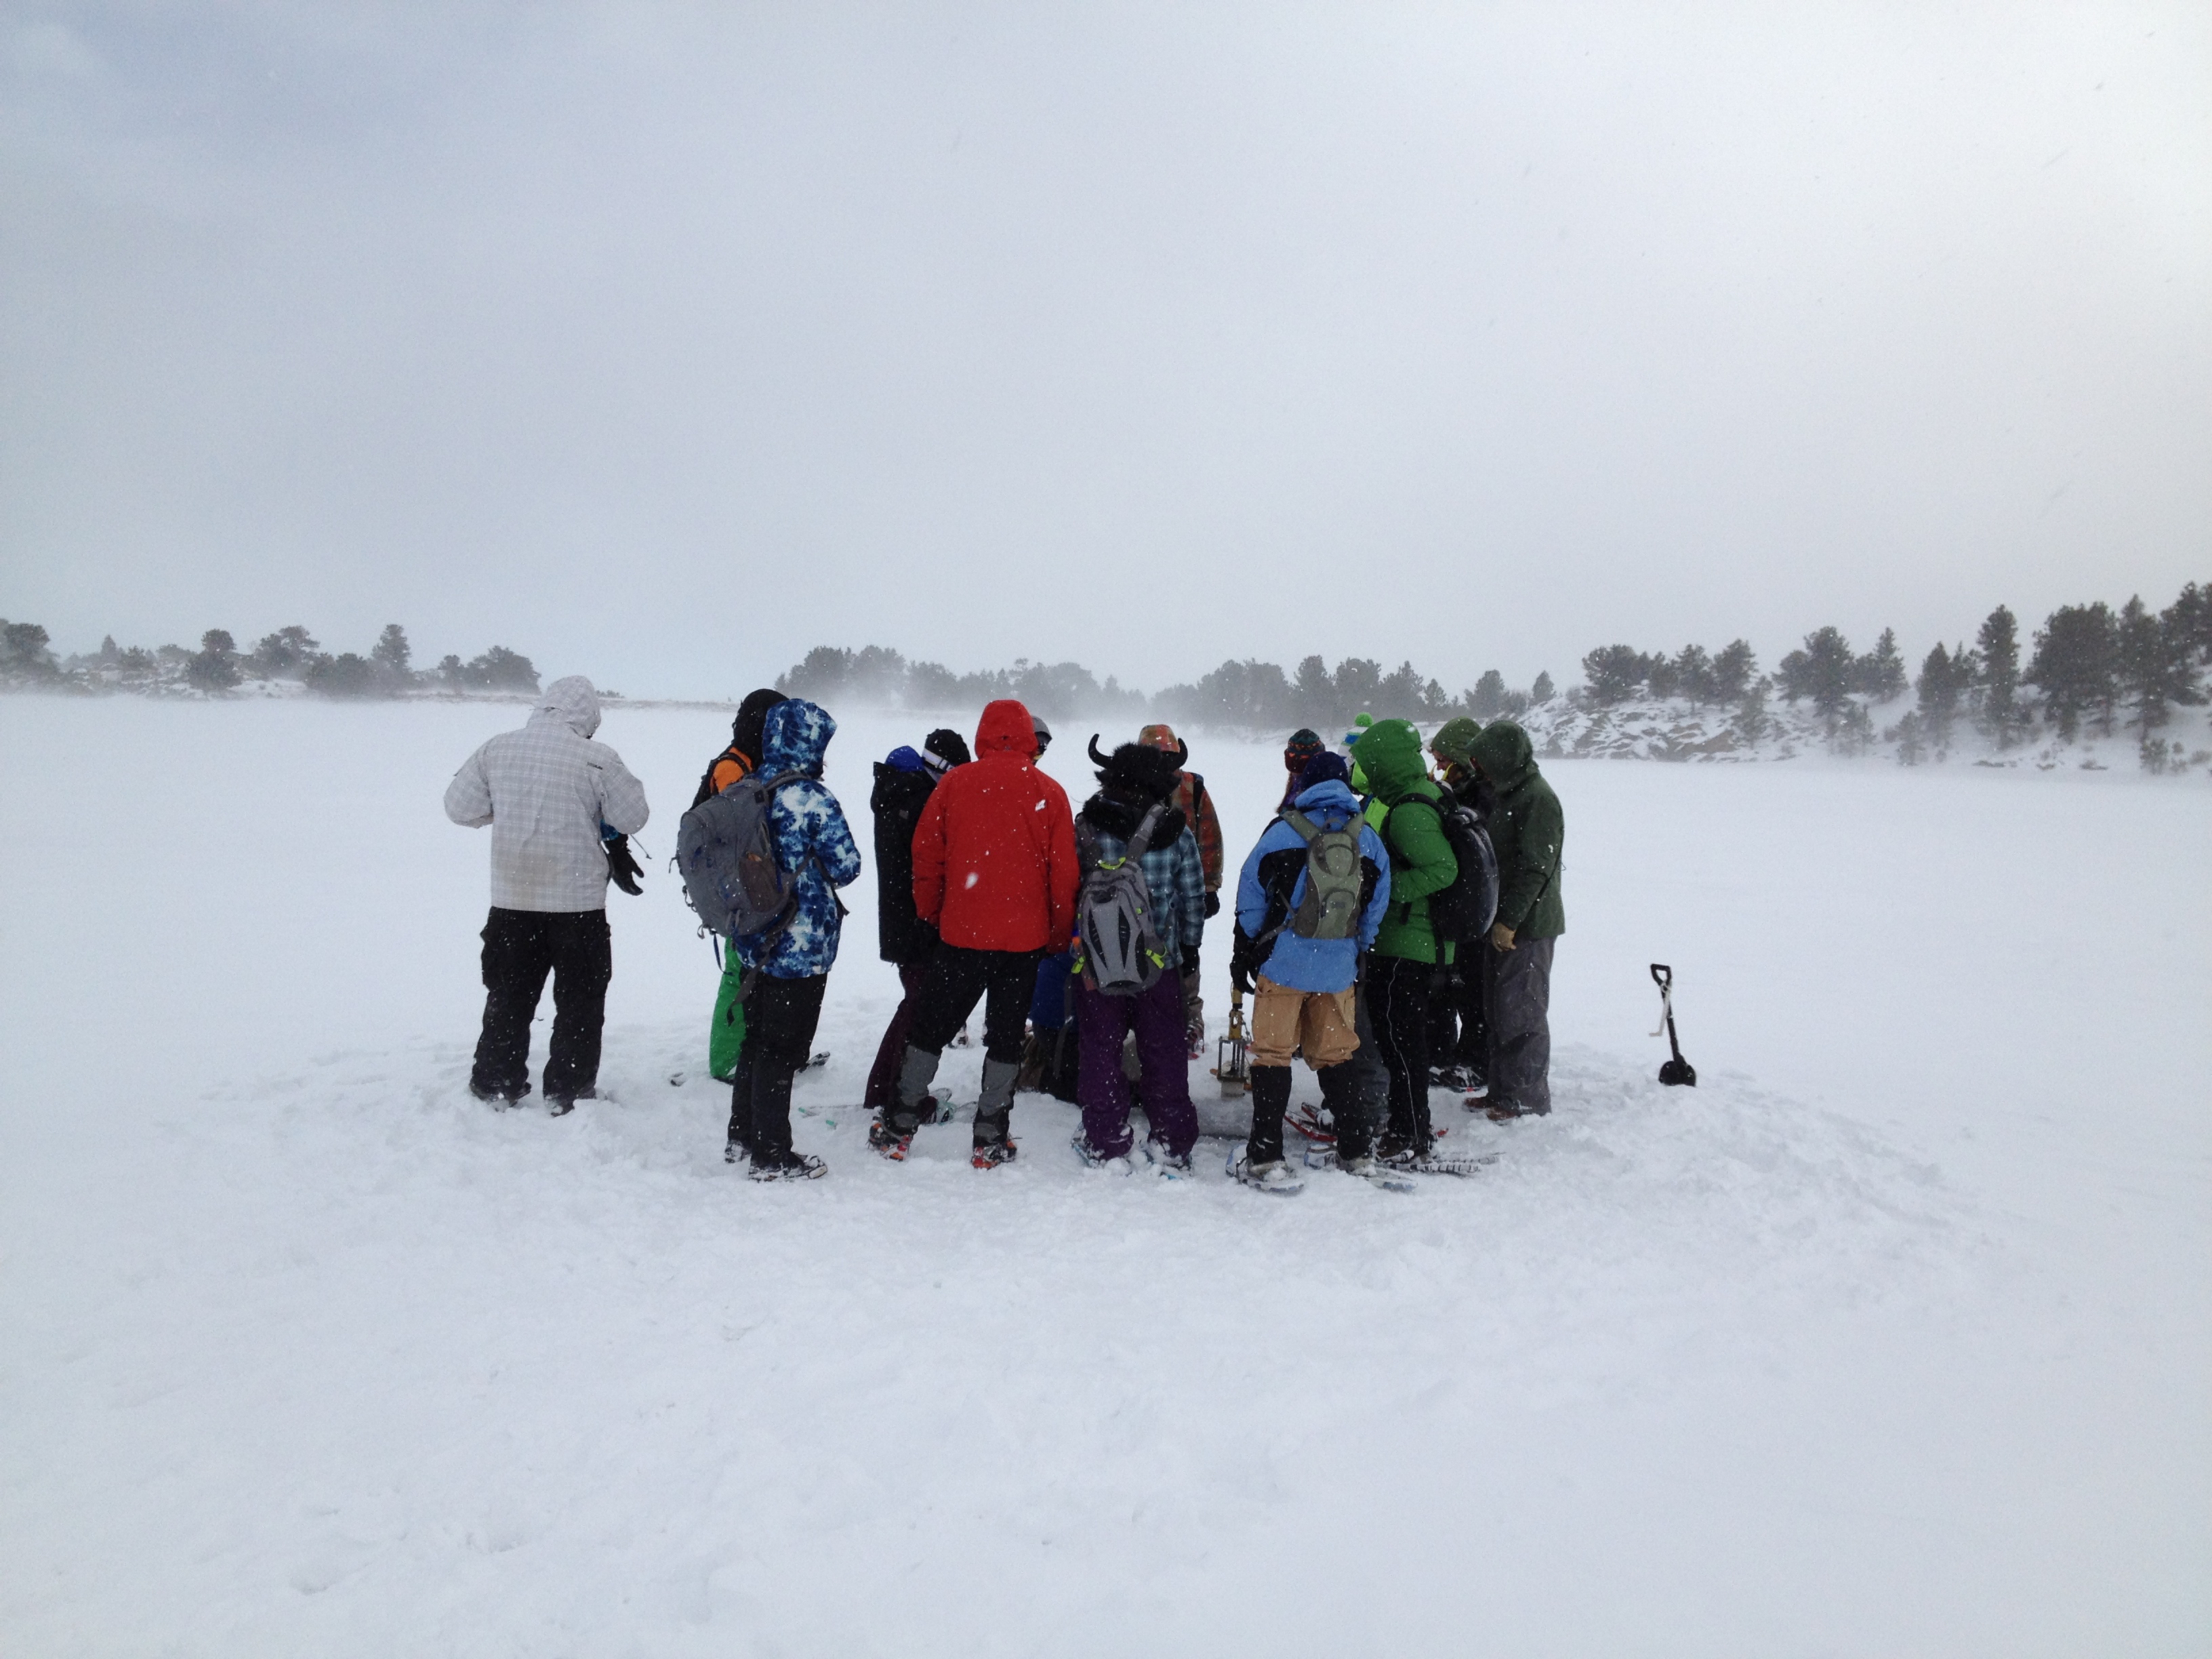 Mid-lake
measurements
Photo: (c) T Kittel
Following
Photos: (c) S.Spaulding
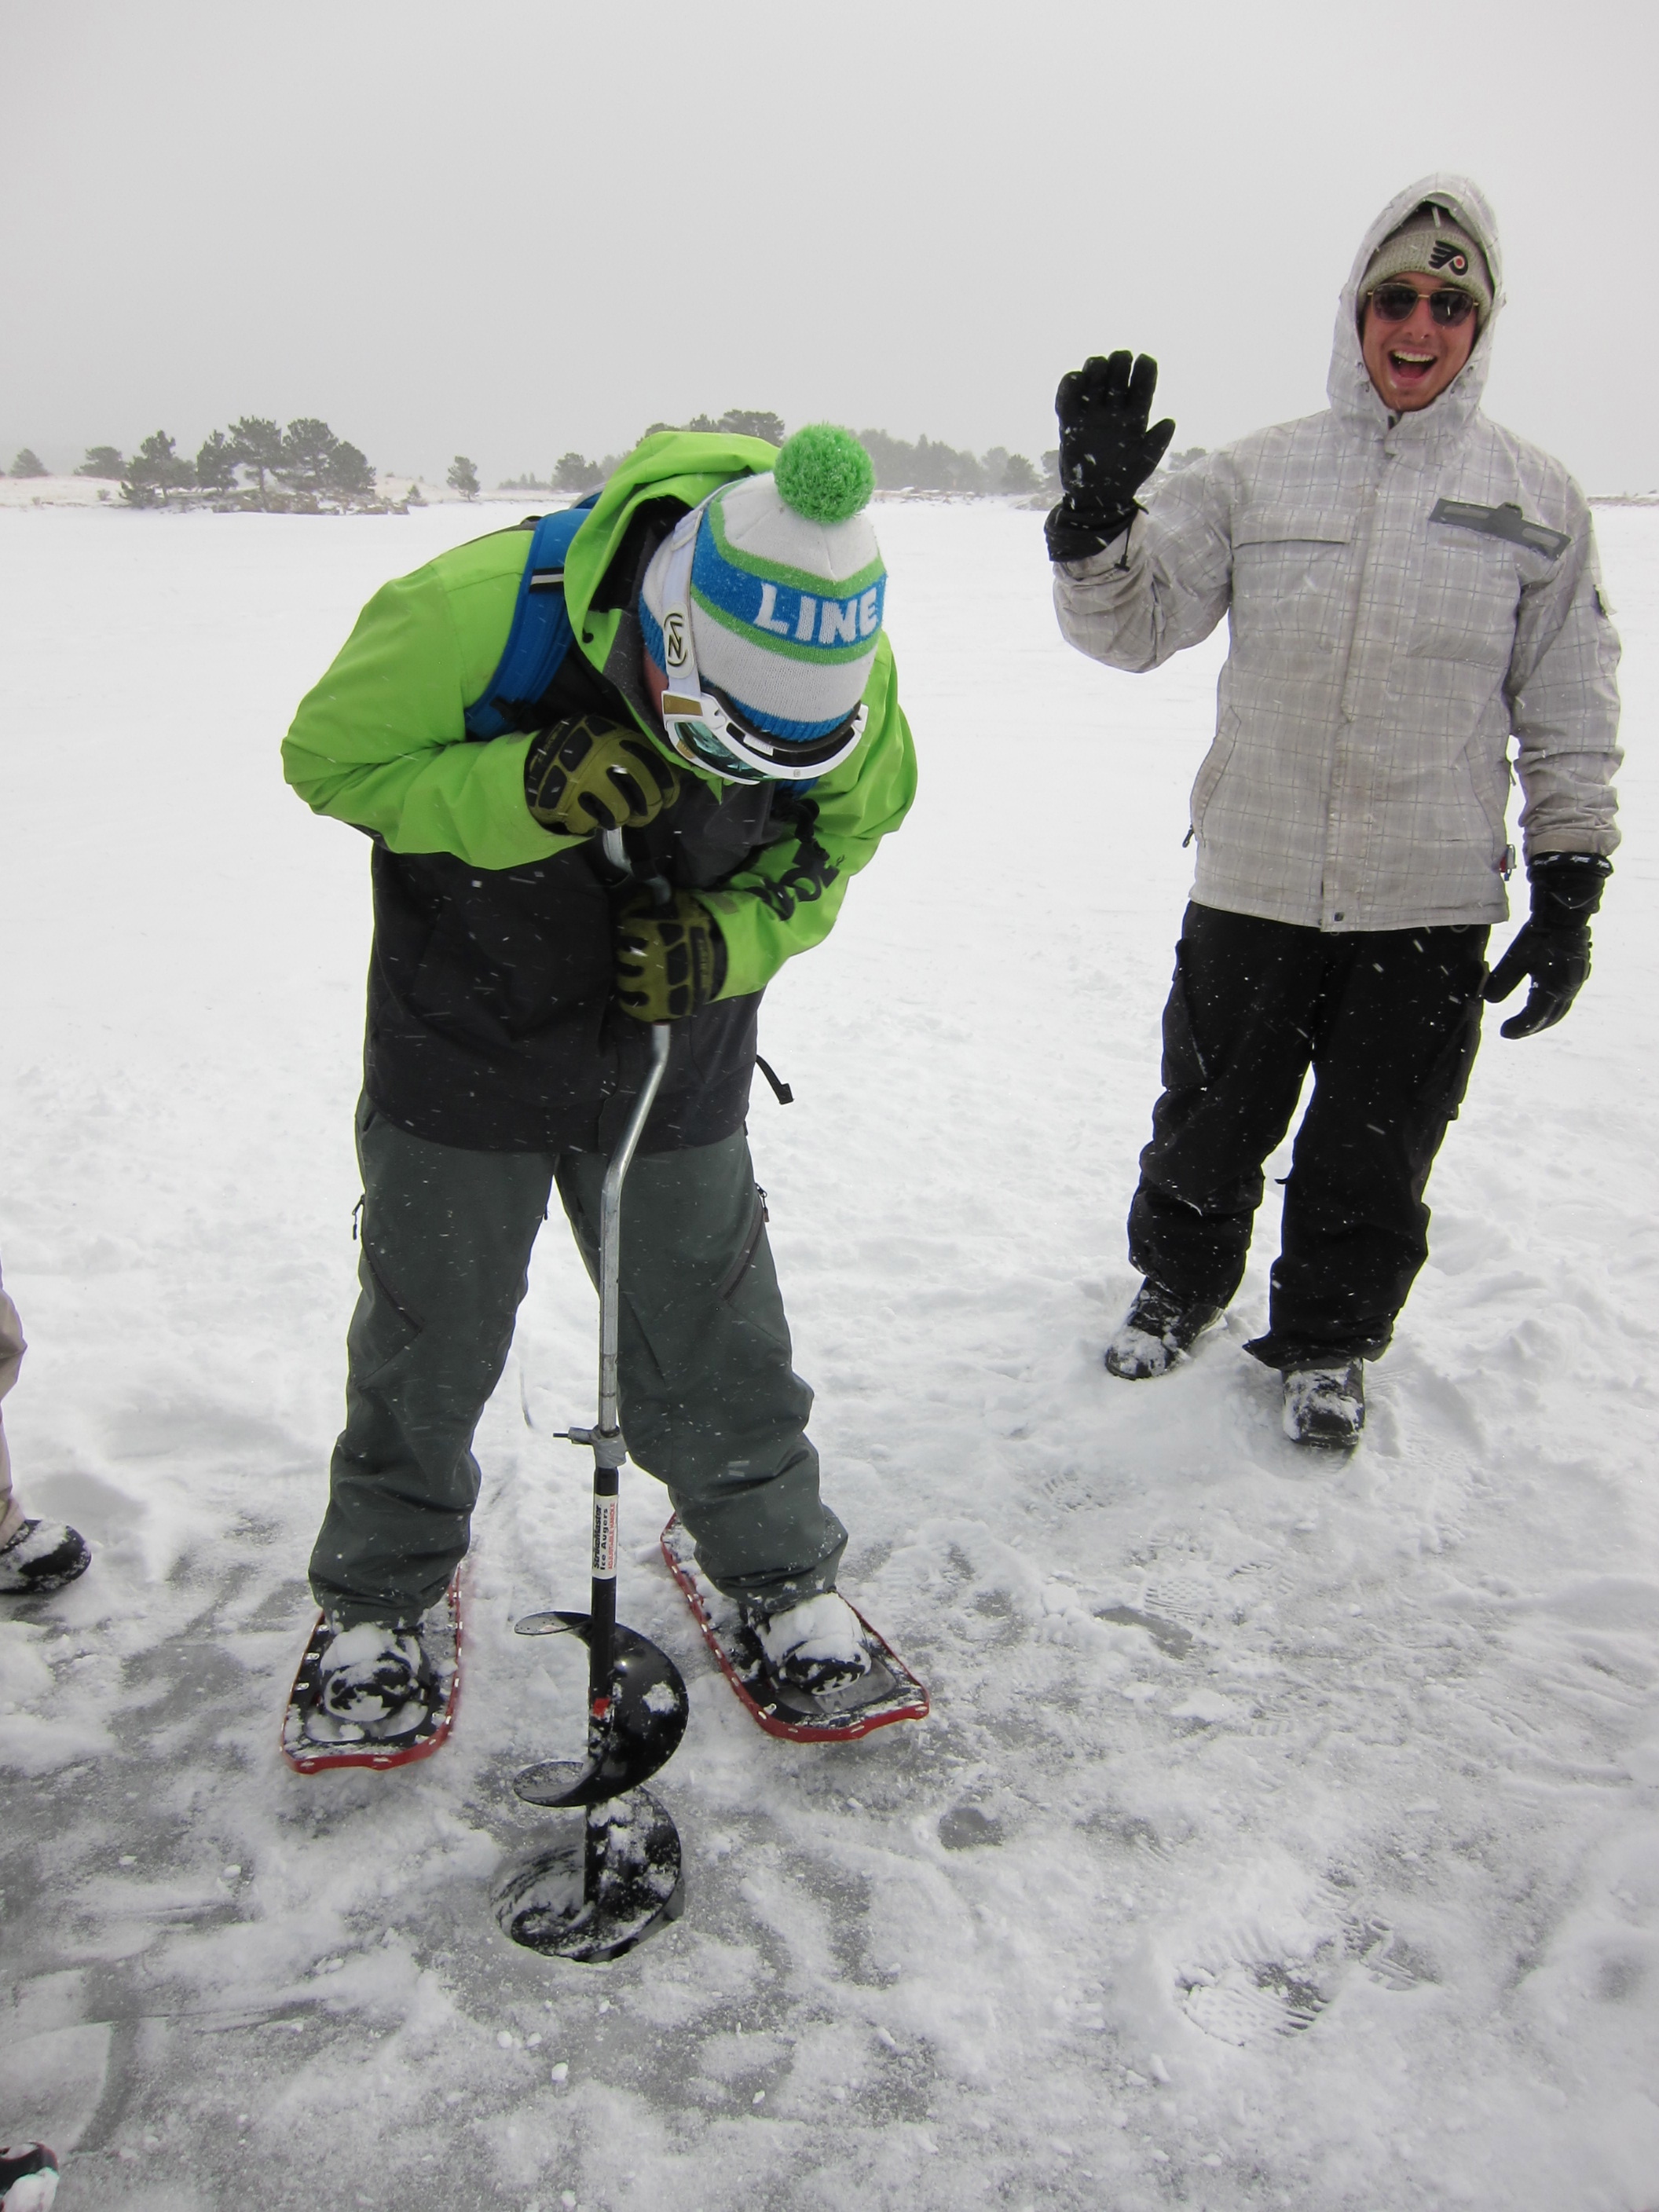
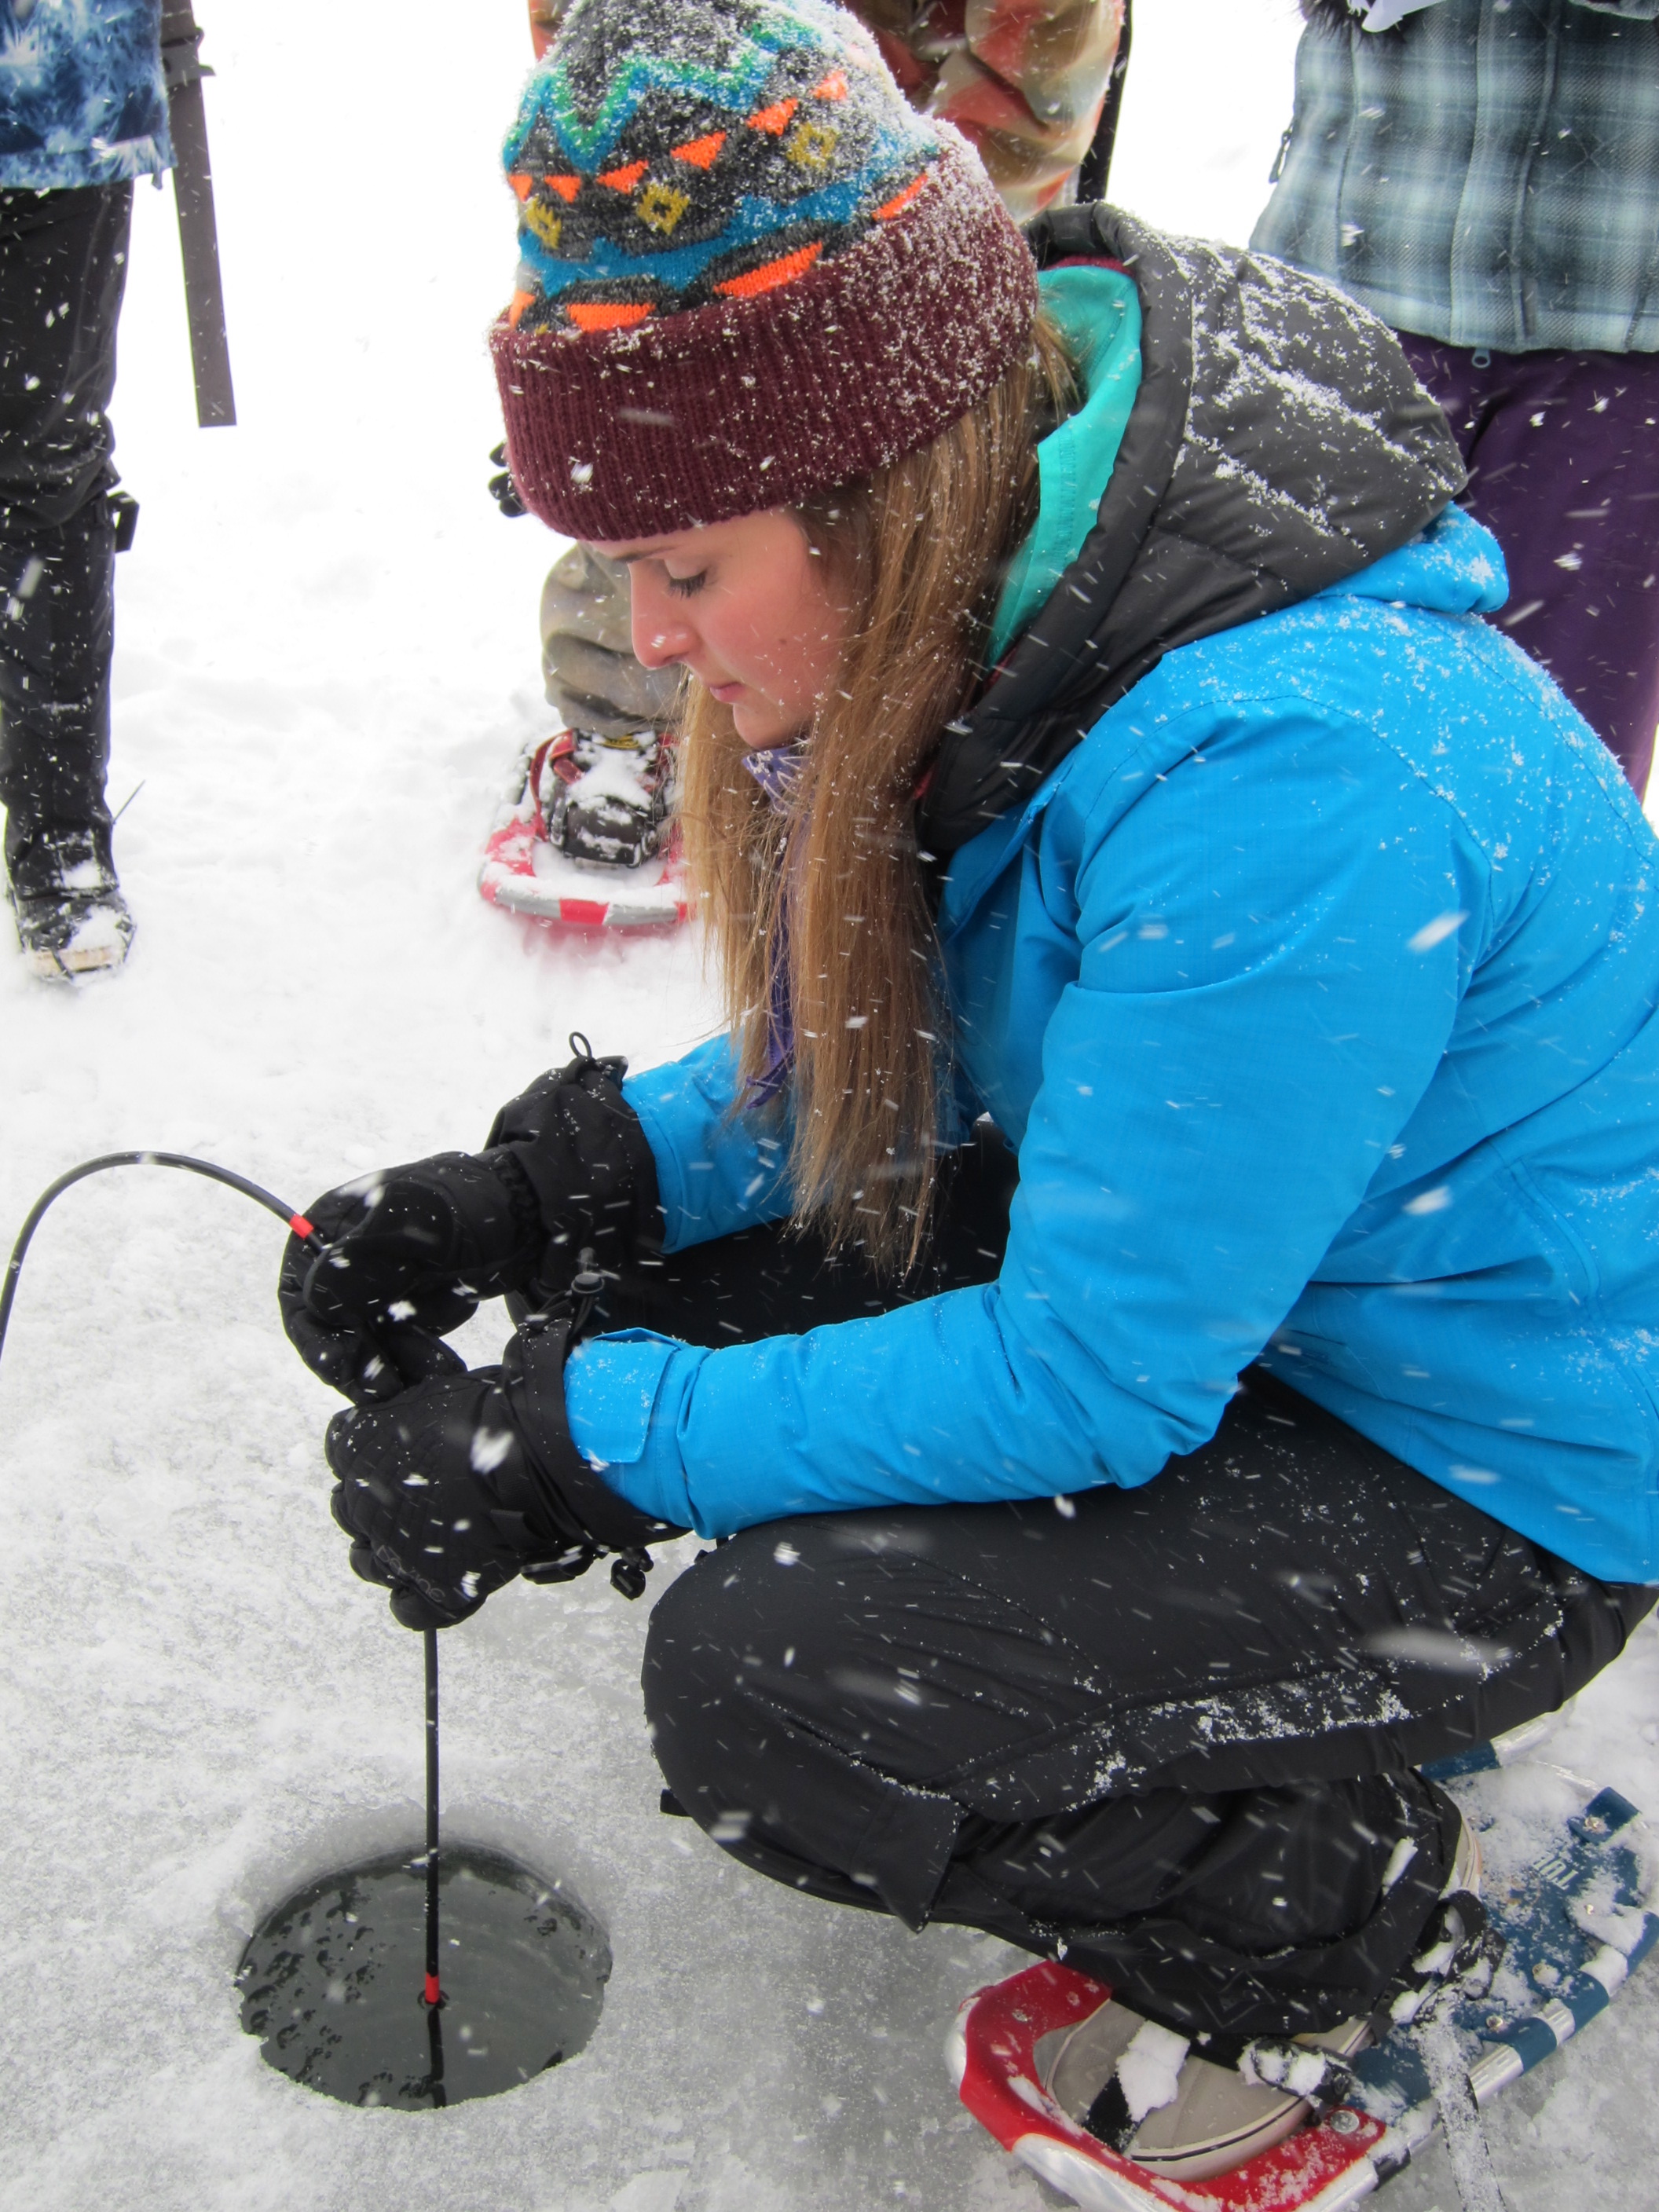
 Hydrolab
sonde profile - physical measurements
|
2013
|
2/16/13 Gold Lake -
- Profile composite: Blackboard+Filters (pdf,
2M)
- Datasheet (pdf,
2M)
- Ice thickness = 16" (40cm), snow-free (except small
patches). Clear sky, breezy, air T above 0C.
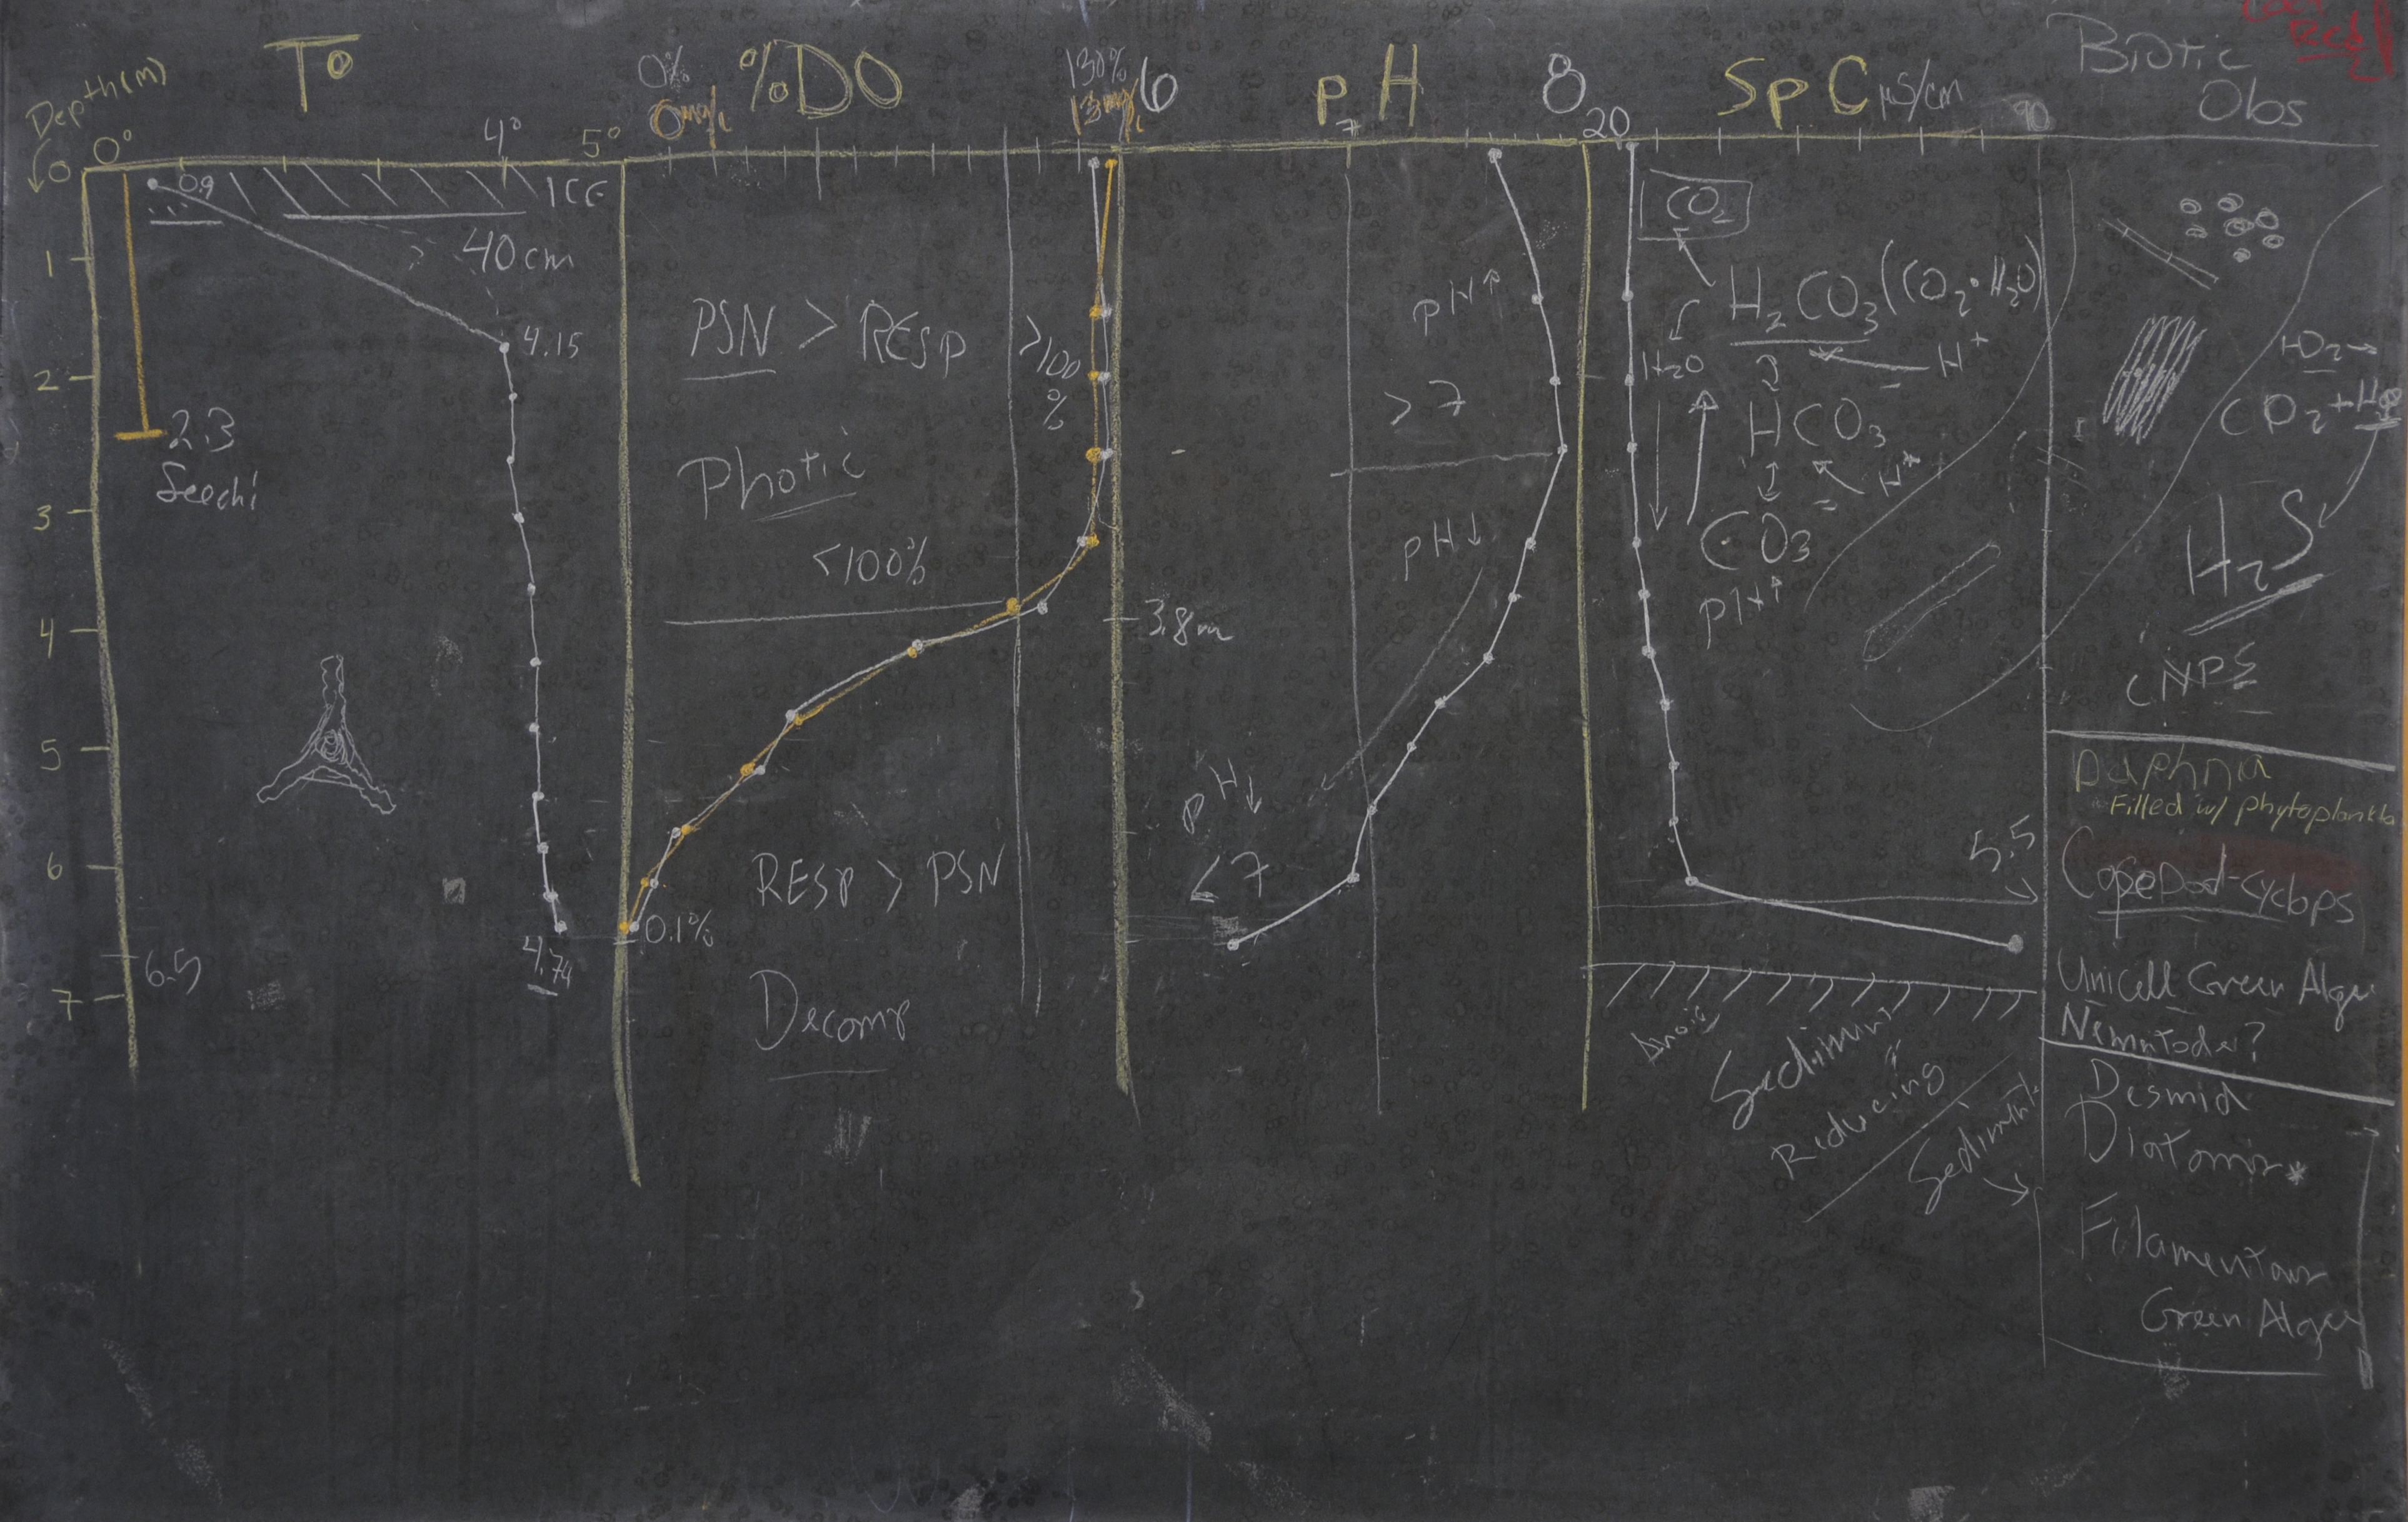 Click images to
enlarge -
See also
composite of physical and filter profiles
 ( pdf)
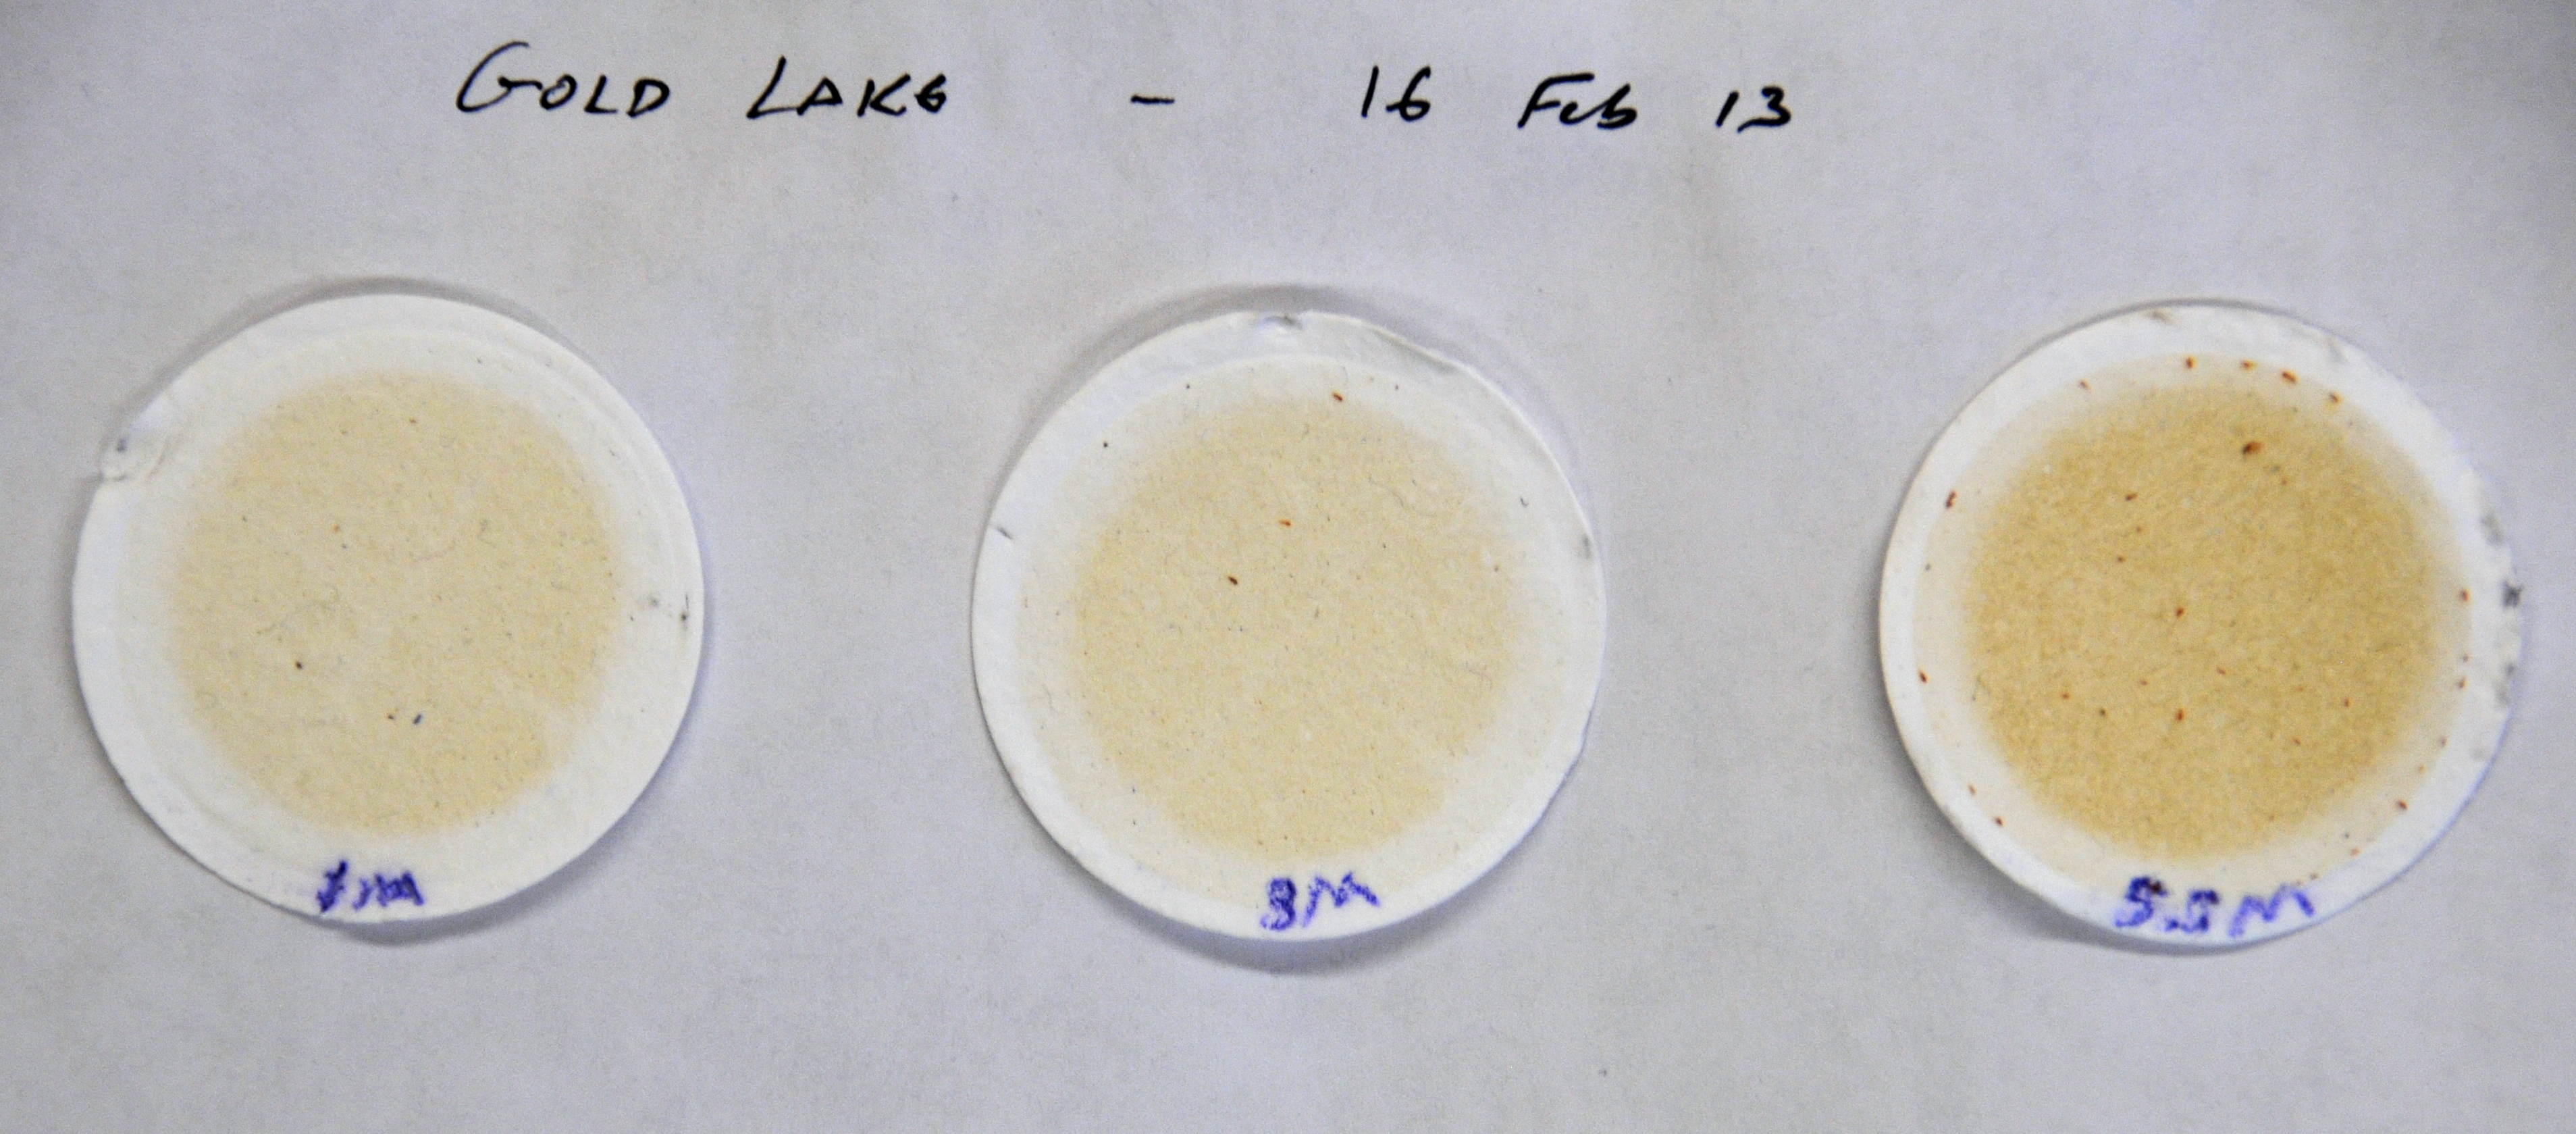
|
Click
images to enlarge -
|
2012
|
1/28/12 Gold Lake -
- Blackboard & water sample filter images -
- Composite of physical and biota profiles (pdf,
140k)
- Datasheet (pdf,
400k)
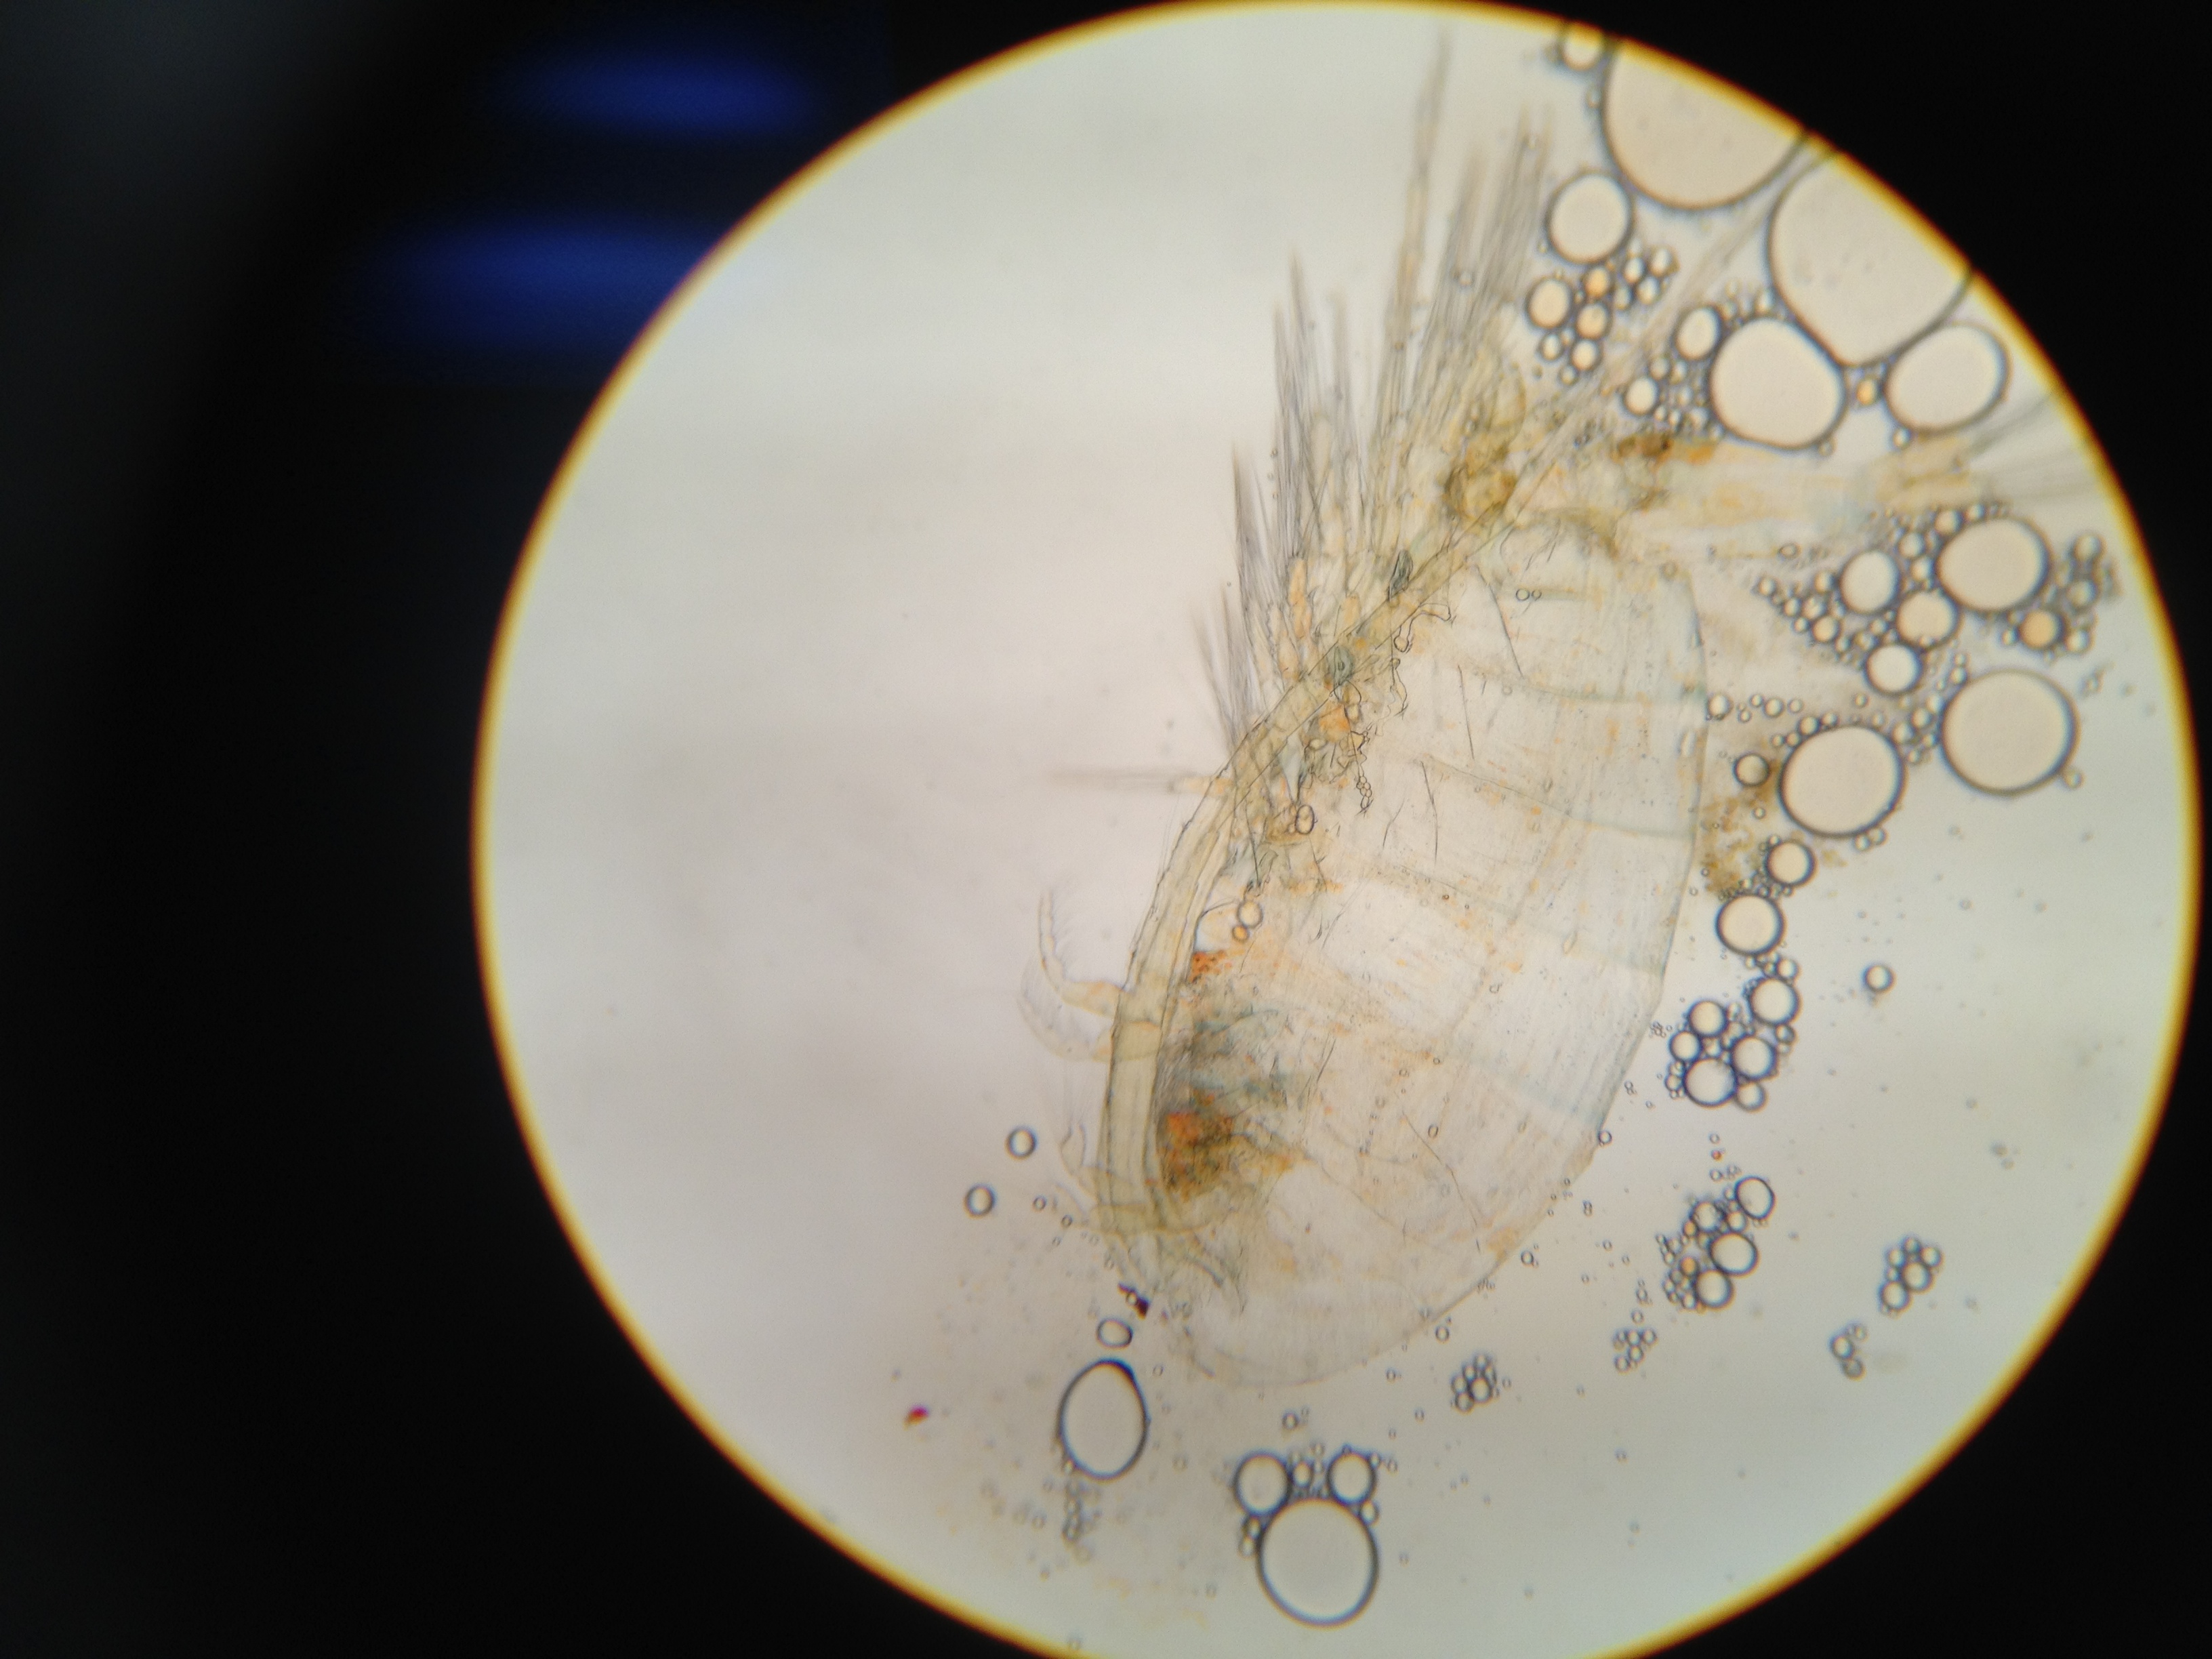 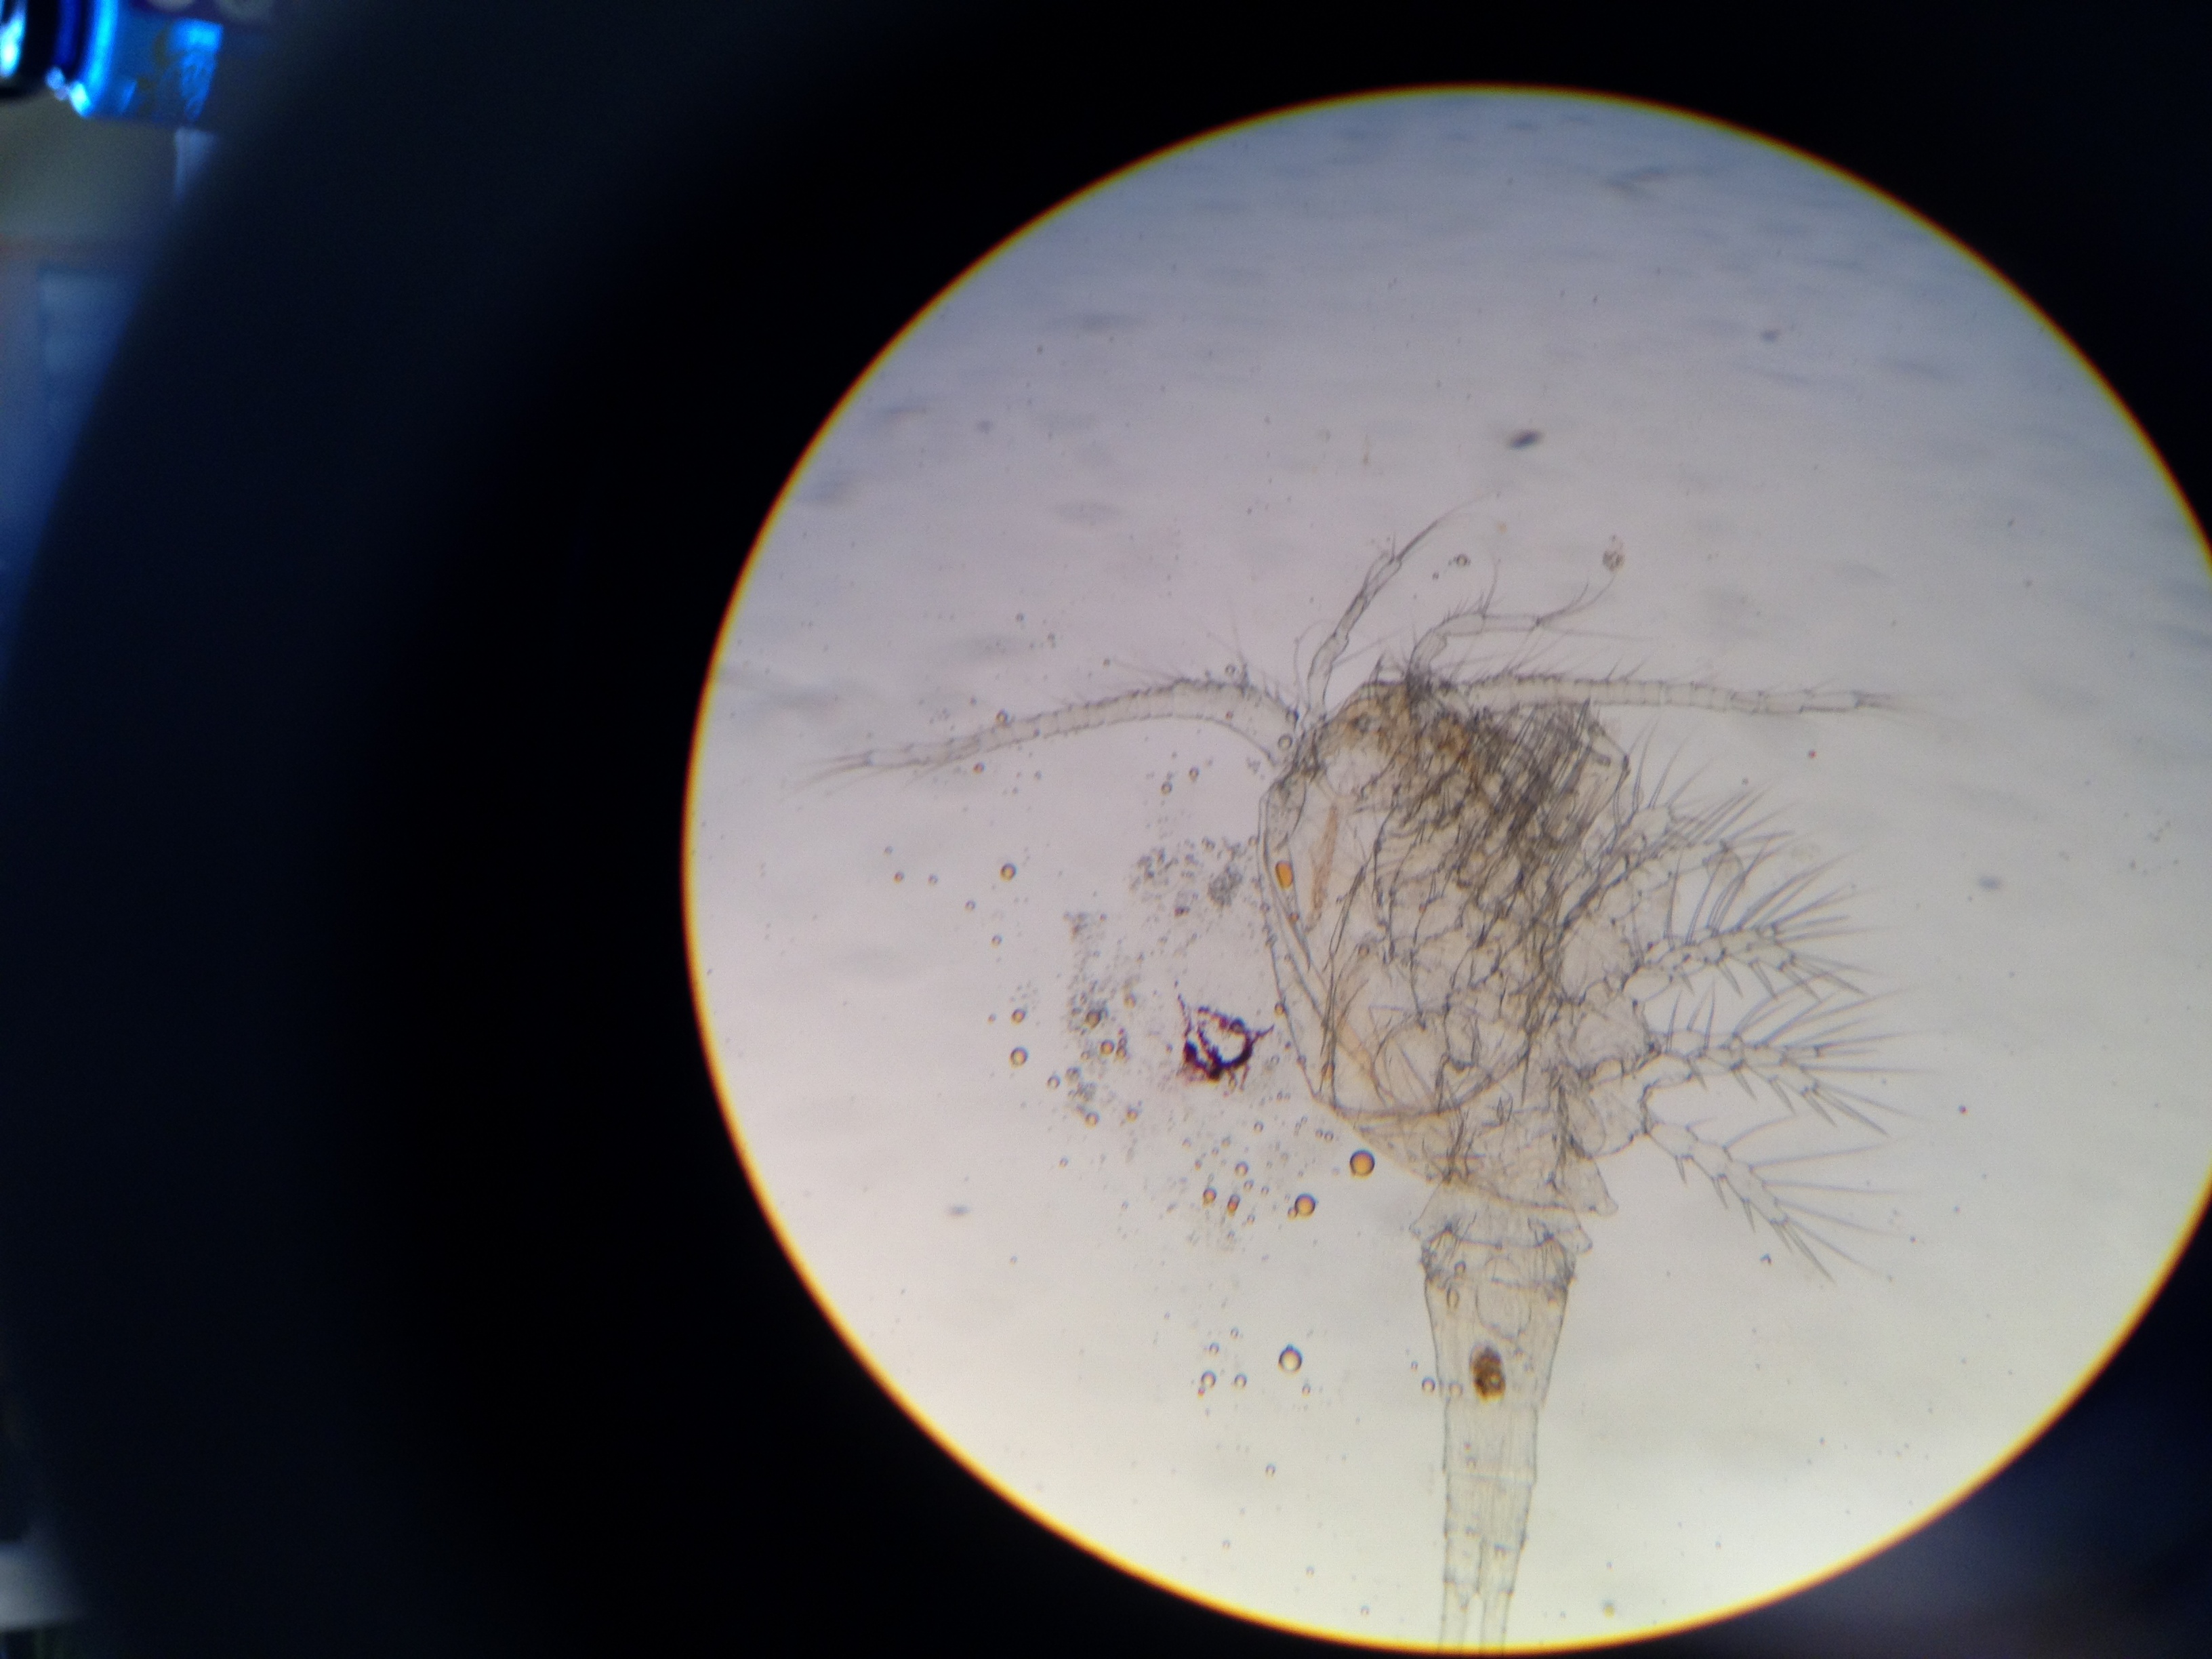 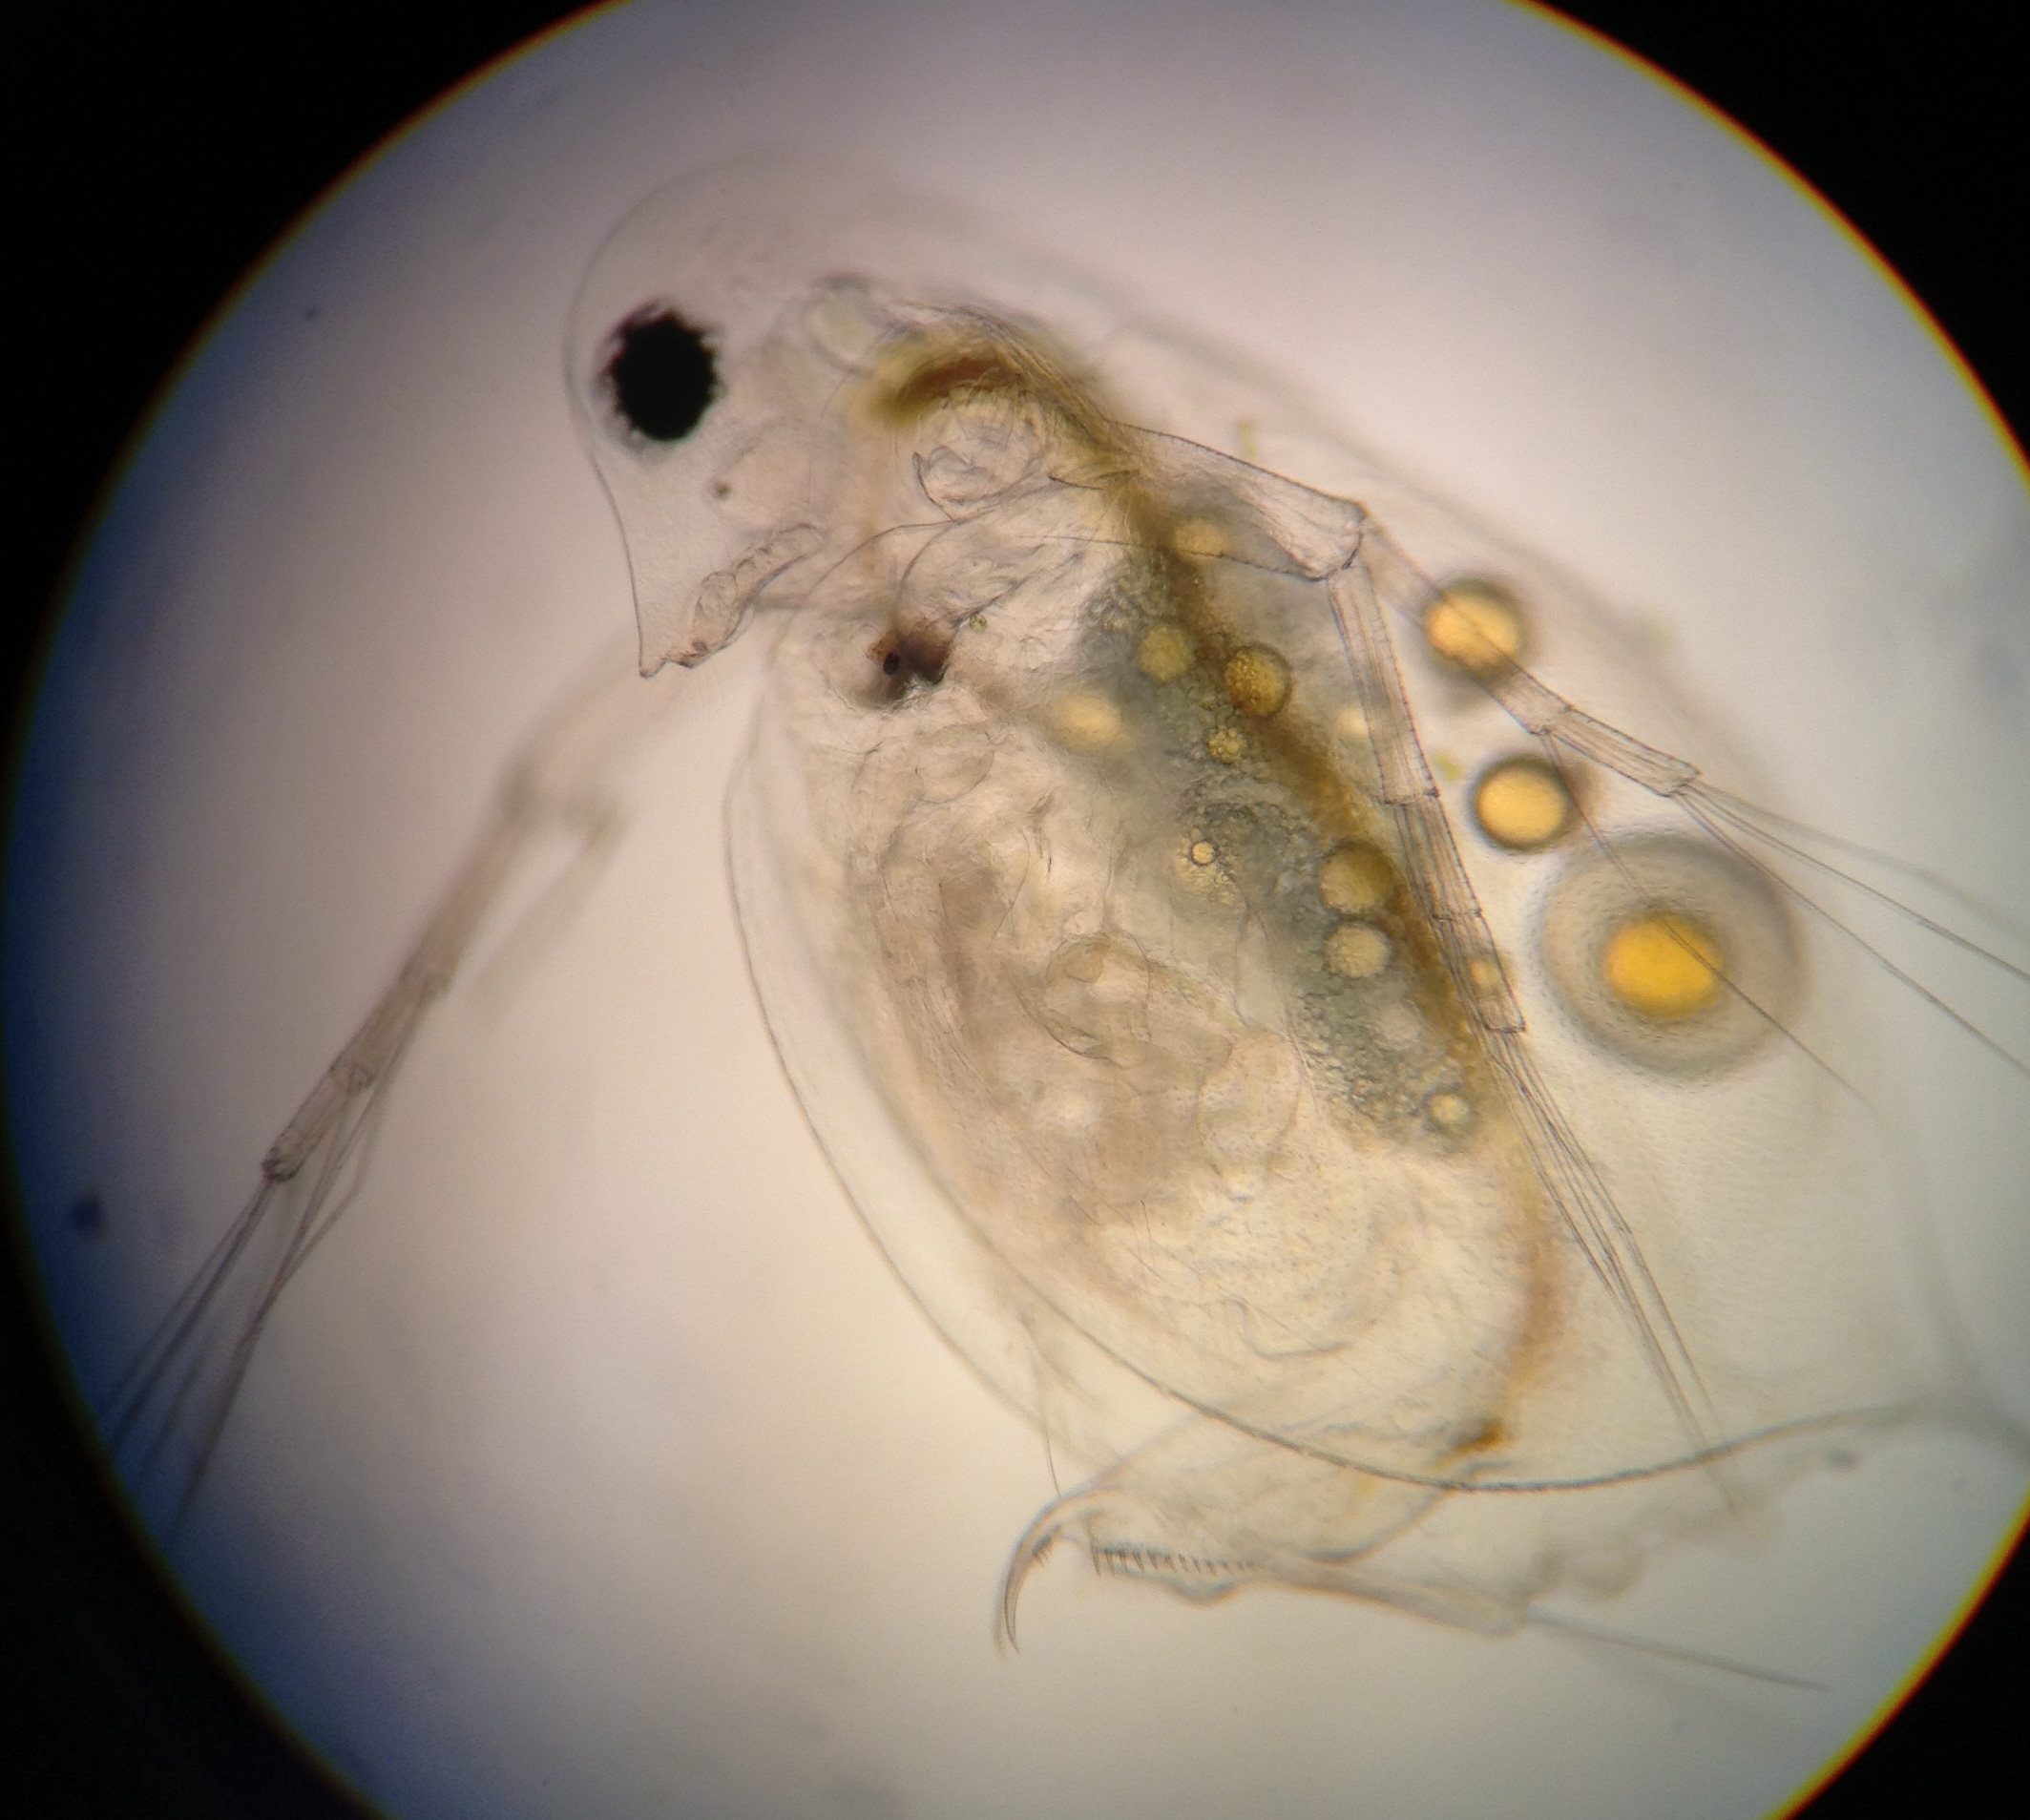
Gold
Lake Zooplankton - Copepods (left, center),
Daphne (right)
--Microphotos by Corey Slinkard (c) 2012 |
|
|
2011
|
1/29/11 Gold Lake -
- Blackboard & water sample filter images -
- Composite of physical and biota profiles (pdf,
600k)
- Datasheet (pdf,
200k)
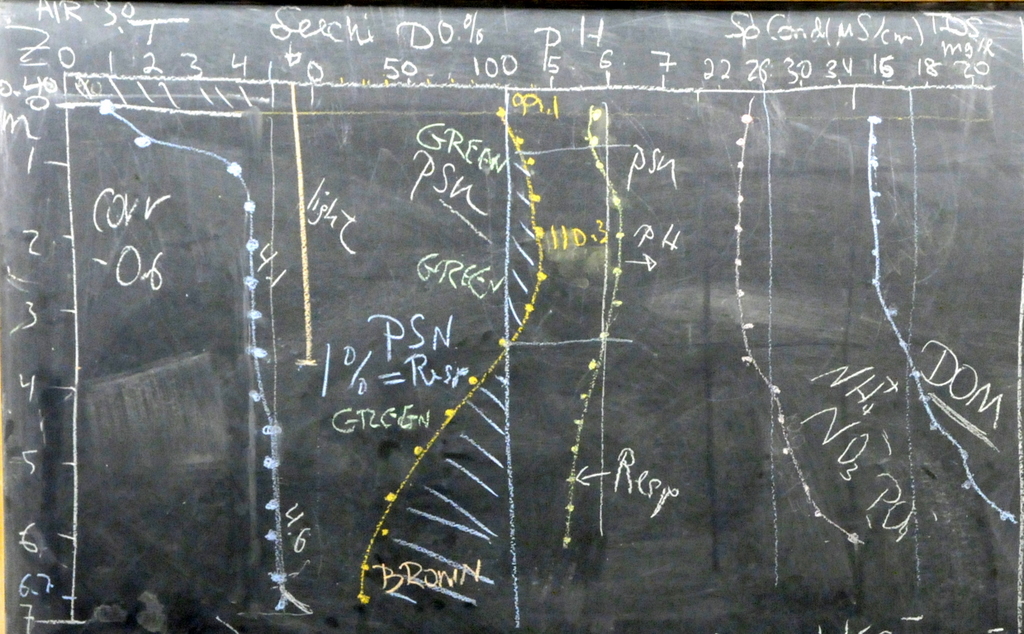
- Summary Discussion -
- On the day of our visit to
Gold Lake, the ice was roughly 18" thick and free
of snow. Lake temperatures were near
zero under the ice, and then close to 4deg C for
the rest of the column (Vertical profile of
temperature = 1st curve on the right in the image
below).
- High levels of Dissolved
Oxygen (yellow chalk line, middle of image) were
seen under the ice to a depth of over 3m.
This indicates significant plant (phytoplankton)
production going on under the ice, in the high
light environment.
- Production is likely limited
by nutrients shown by reduced Specific
Conductivity (white line 2nd from right) in the
upper waters.
- We also observed highest
numbers of zooplankton in the upper layer - with
gravid (egg-bearing) copepods suggesting that
crustacean populations are doing well grazing on
the lake's phytoplankton.
- Below 3m, light levels drop
below 1%. At this point, plant production
drops sharply and decomposition takes over as the
dominant process.
- Nutrient release by
decomposition is shown in higher Specific
Conductivity (white line 2nd from right). In
spring, with ice breakup, these nutrients will be
returned to the upper level of the lake, restoring
nutrients for plant production.
 Click images to enlarge -
See also
composite of physical and biota profiles ( pdf)
|

Vertical Profile measurements
Photo: (c) T Kittel
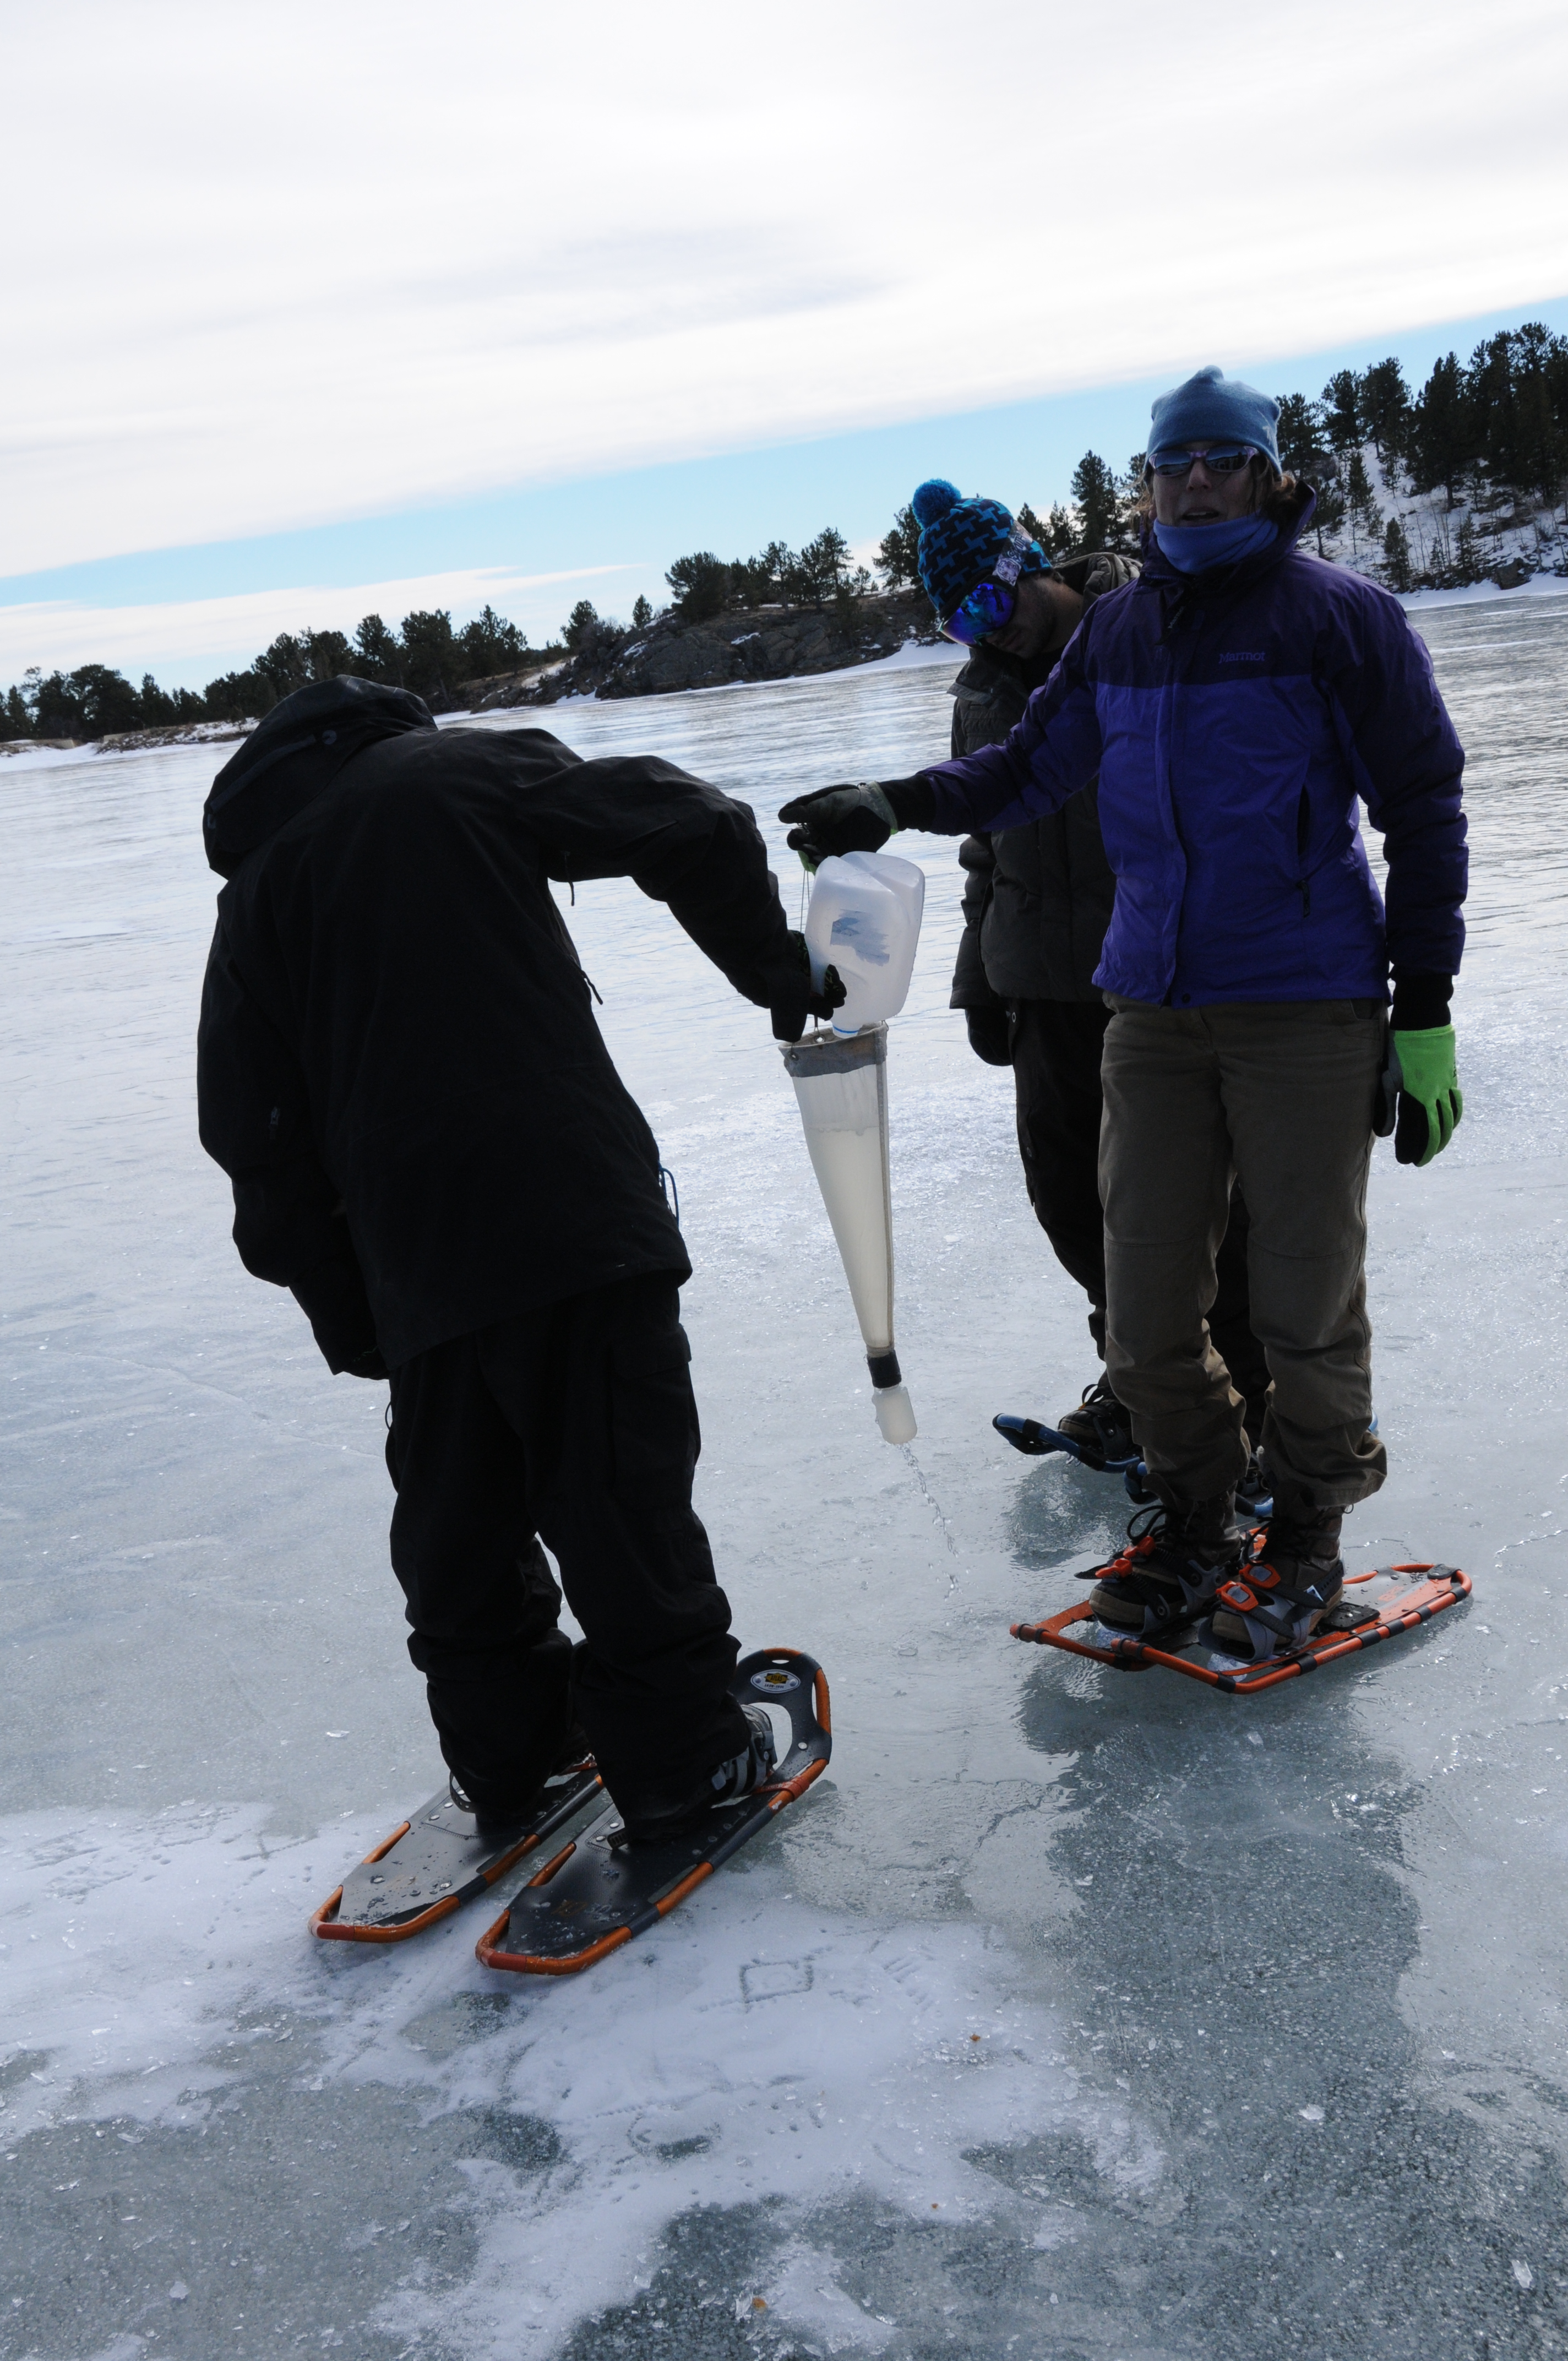
Zooplankton Sampling -
Photo: (c) T Kittel |
| 2010 |
2/2010 Gold Lake
-
- Summary & Photos (ppt,
4.5M)
- Data (xlsx,
50k)
|
|
| 2009 |
2/21/09 Lily Lake
-
- Blackboard
image of sonde profiles & biota notes (pdf,
3M)
- Plankton (and
more) filters (jpg,
800k) - c/o Sara Fairchild
|
|
| 2008 |
2/23/08 Gold Lake
-
- Winter Profiles
(datasheet pdf,
390k)
- Blackboard
image - sonde profiles and biota notes (jpg,
800k, c/o David Rosengarten)
- Phytoplankton
Filters (jpg,
580k)
|
|
| 2006 |
2/26/06 Gold Lake -
- Winter Profiles
(xls,
20k, c/o Jyh Huang)
Phytoplankton Filters (jpg, 300k)
|

Zooplankton
Sampling -
Photo: (c) T Kittel
|
| 2005 |
Spring '05 Gold Lake
-
- Winter Profiles
(data: xls,
35k - plots: pdf,
190k)
- Phytoplankton
Filters (jpg,
300k)
|
Drilling
hole in ice for sampling
Photo: (c) T Kittel
|




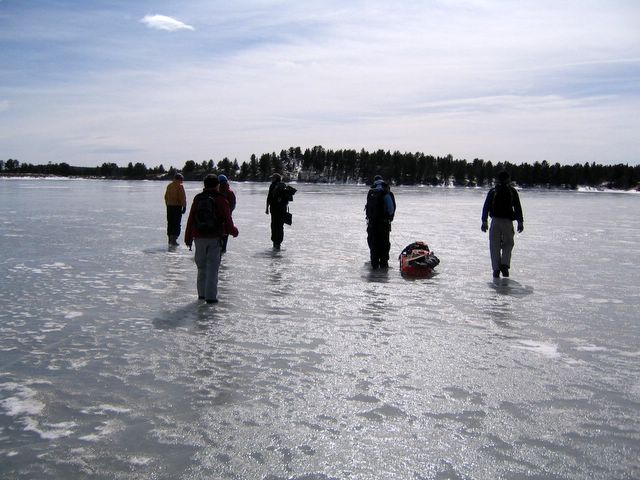 Winter Ecology
Results