 Winter Ecology
Results
Winter Ecology
ResultsResults - Snowpack -
- Do you see a correspondence between
layers in your snowpits (graph
below) and weather history (graph
in right panel)? If yes or no,
explain in terms of:
- Snowpack accumulation (suggesting possible layers)
- Consolidation (as shown by snowpack
depth and density)
- Melt periods, from Tmax
- Periods of depth hoar formation (faceting), from Tmin (& Tmax) record
- See also -
- Overall Lessons Points re snow
- Lesson Points for the snowpack field activity
- Additional Discussion under 2013 Results
- Snowpack profiles - individual plots (pdf, 600k) -- images below
- C1 Snotel & climate data (in pdf above, and xlsx, 100k) -- image to the right
- Do you see a correspondence between
layers in your snowpits (graphs
below) and weather history (graph
in right panel)? If yes or no,
explain in terms of:
- Snowpack accumulation (suggesting possible layers I-IV)
- Consolidation (as shown by snowpack
depth and density)
- Melt periods, from Tmax
- Periods of depth hoar formation (faceting), from Tmin (& Tmax) record
- See also -
- Overall Lessons Points re snow
- Lesson Points for the snowpack field activity
- Discussion under 2013 Results
- Snowpack profiles - individual plots (pdf, 700k) -- images below
- C1 Snotel & climate data (in pdf above, and xlsx, 100k) -- image to the right
- Discussion
- Do you see a correspondence between
layers in your snowpits (graphs
below) and weather history (graph
in right panel)? In terms of:
- Snowpack accumulation
- Consolidation (as shown by snowpack
depth and density)
- Melt periods, from Tmax and Diurnal Temperature Range (DTR) record
- note: strong positive DTR
indicates periods of heating (why?)
- Periods of depth hoar formation (faceting), from Tmin (& Tmax) record
- See also -
- Overall Lessons Points re snow
- Lesson Points for the snowpack field activity
- Discussion under 2013 Results
- Snowpack profiles - composite image (image below) & individual plots (pdf, 600k)
- C1 Snotel & climate data (xlsx, 100k) -- composite image to the right
- Photos -- right panel
- Discussion
- Do you see a correspondence between
layers in your snowpits and weather
history (graph in right
panel)? In terms of:
- Snowpack accumulation
- Consolidation (as shown by snowpack
depth and density)
- Melt periods, from Tmax and DTR (diurnal temperature range) record
- note: strong positive DTR
indicates periods of heating (why?)
- Periods of depth hoar formation (faceting), from Tmin (& Tmax) record
- See also
- Overall Lessons Points re snow
- Lesson Points for the snowpack field activity
- Discussion under 2013 Results
- Snowpack profiles - composite image (image below) & individual plots (pdf, 600k)
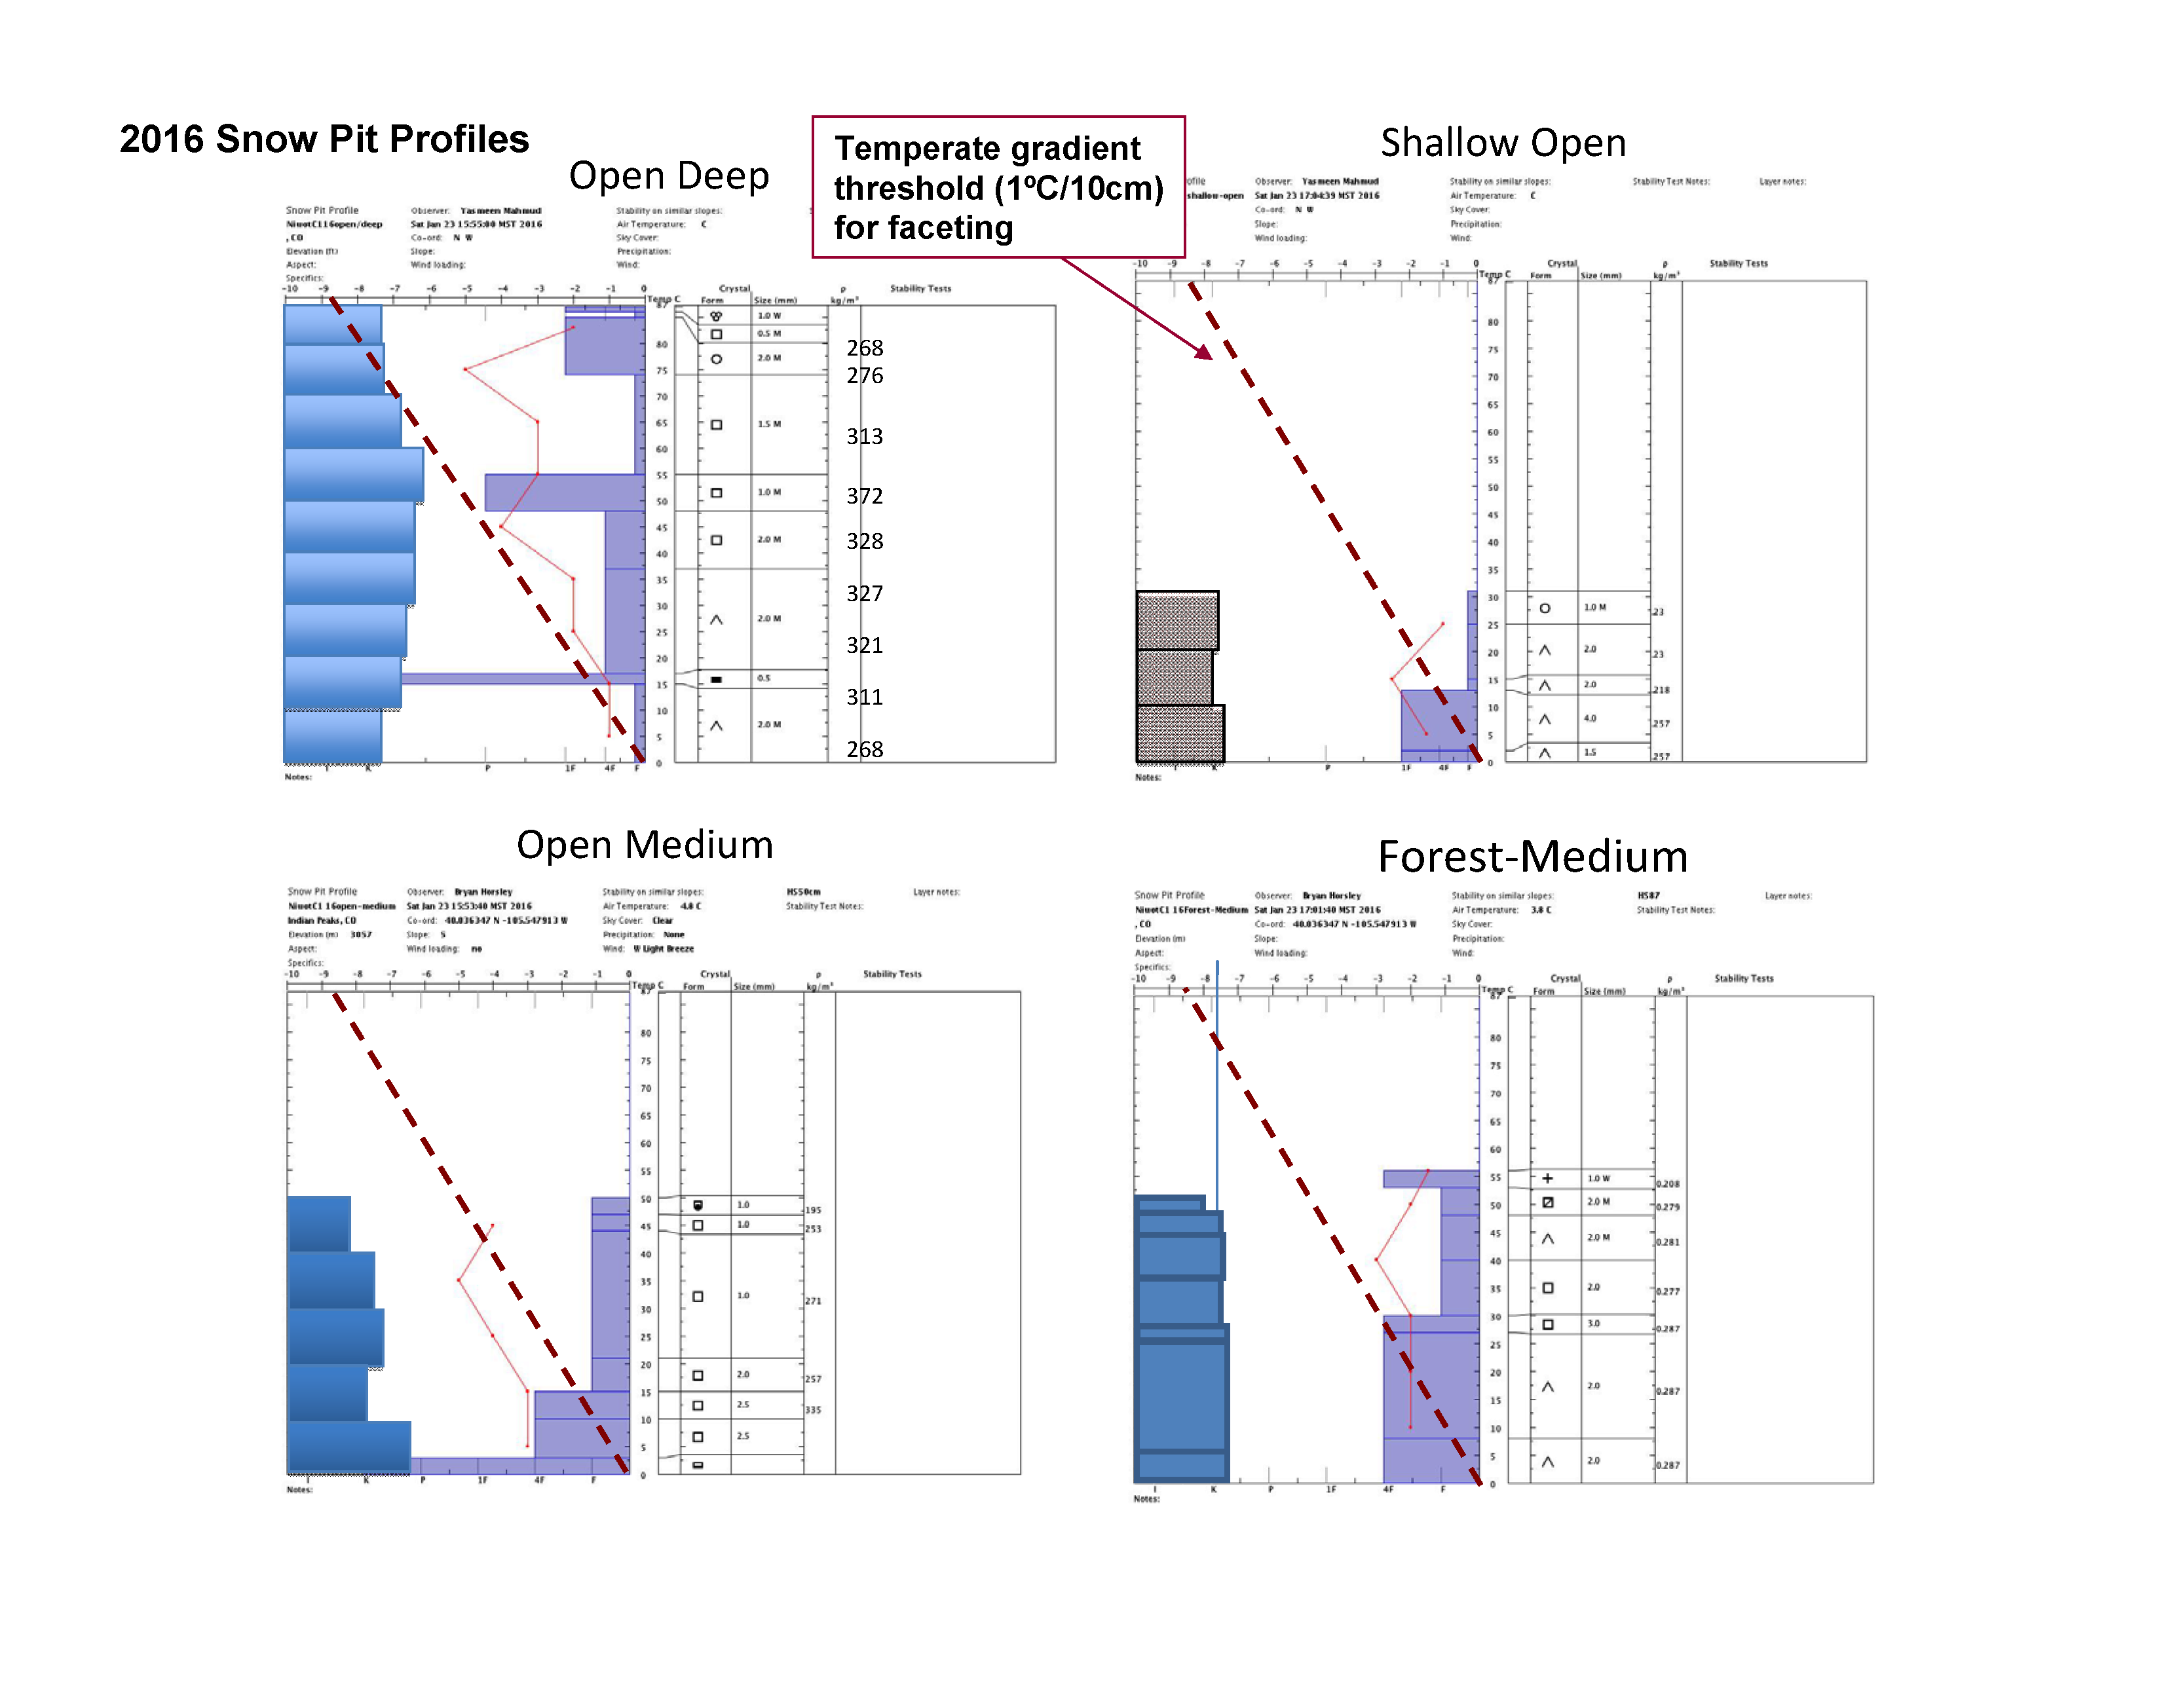
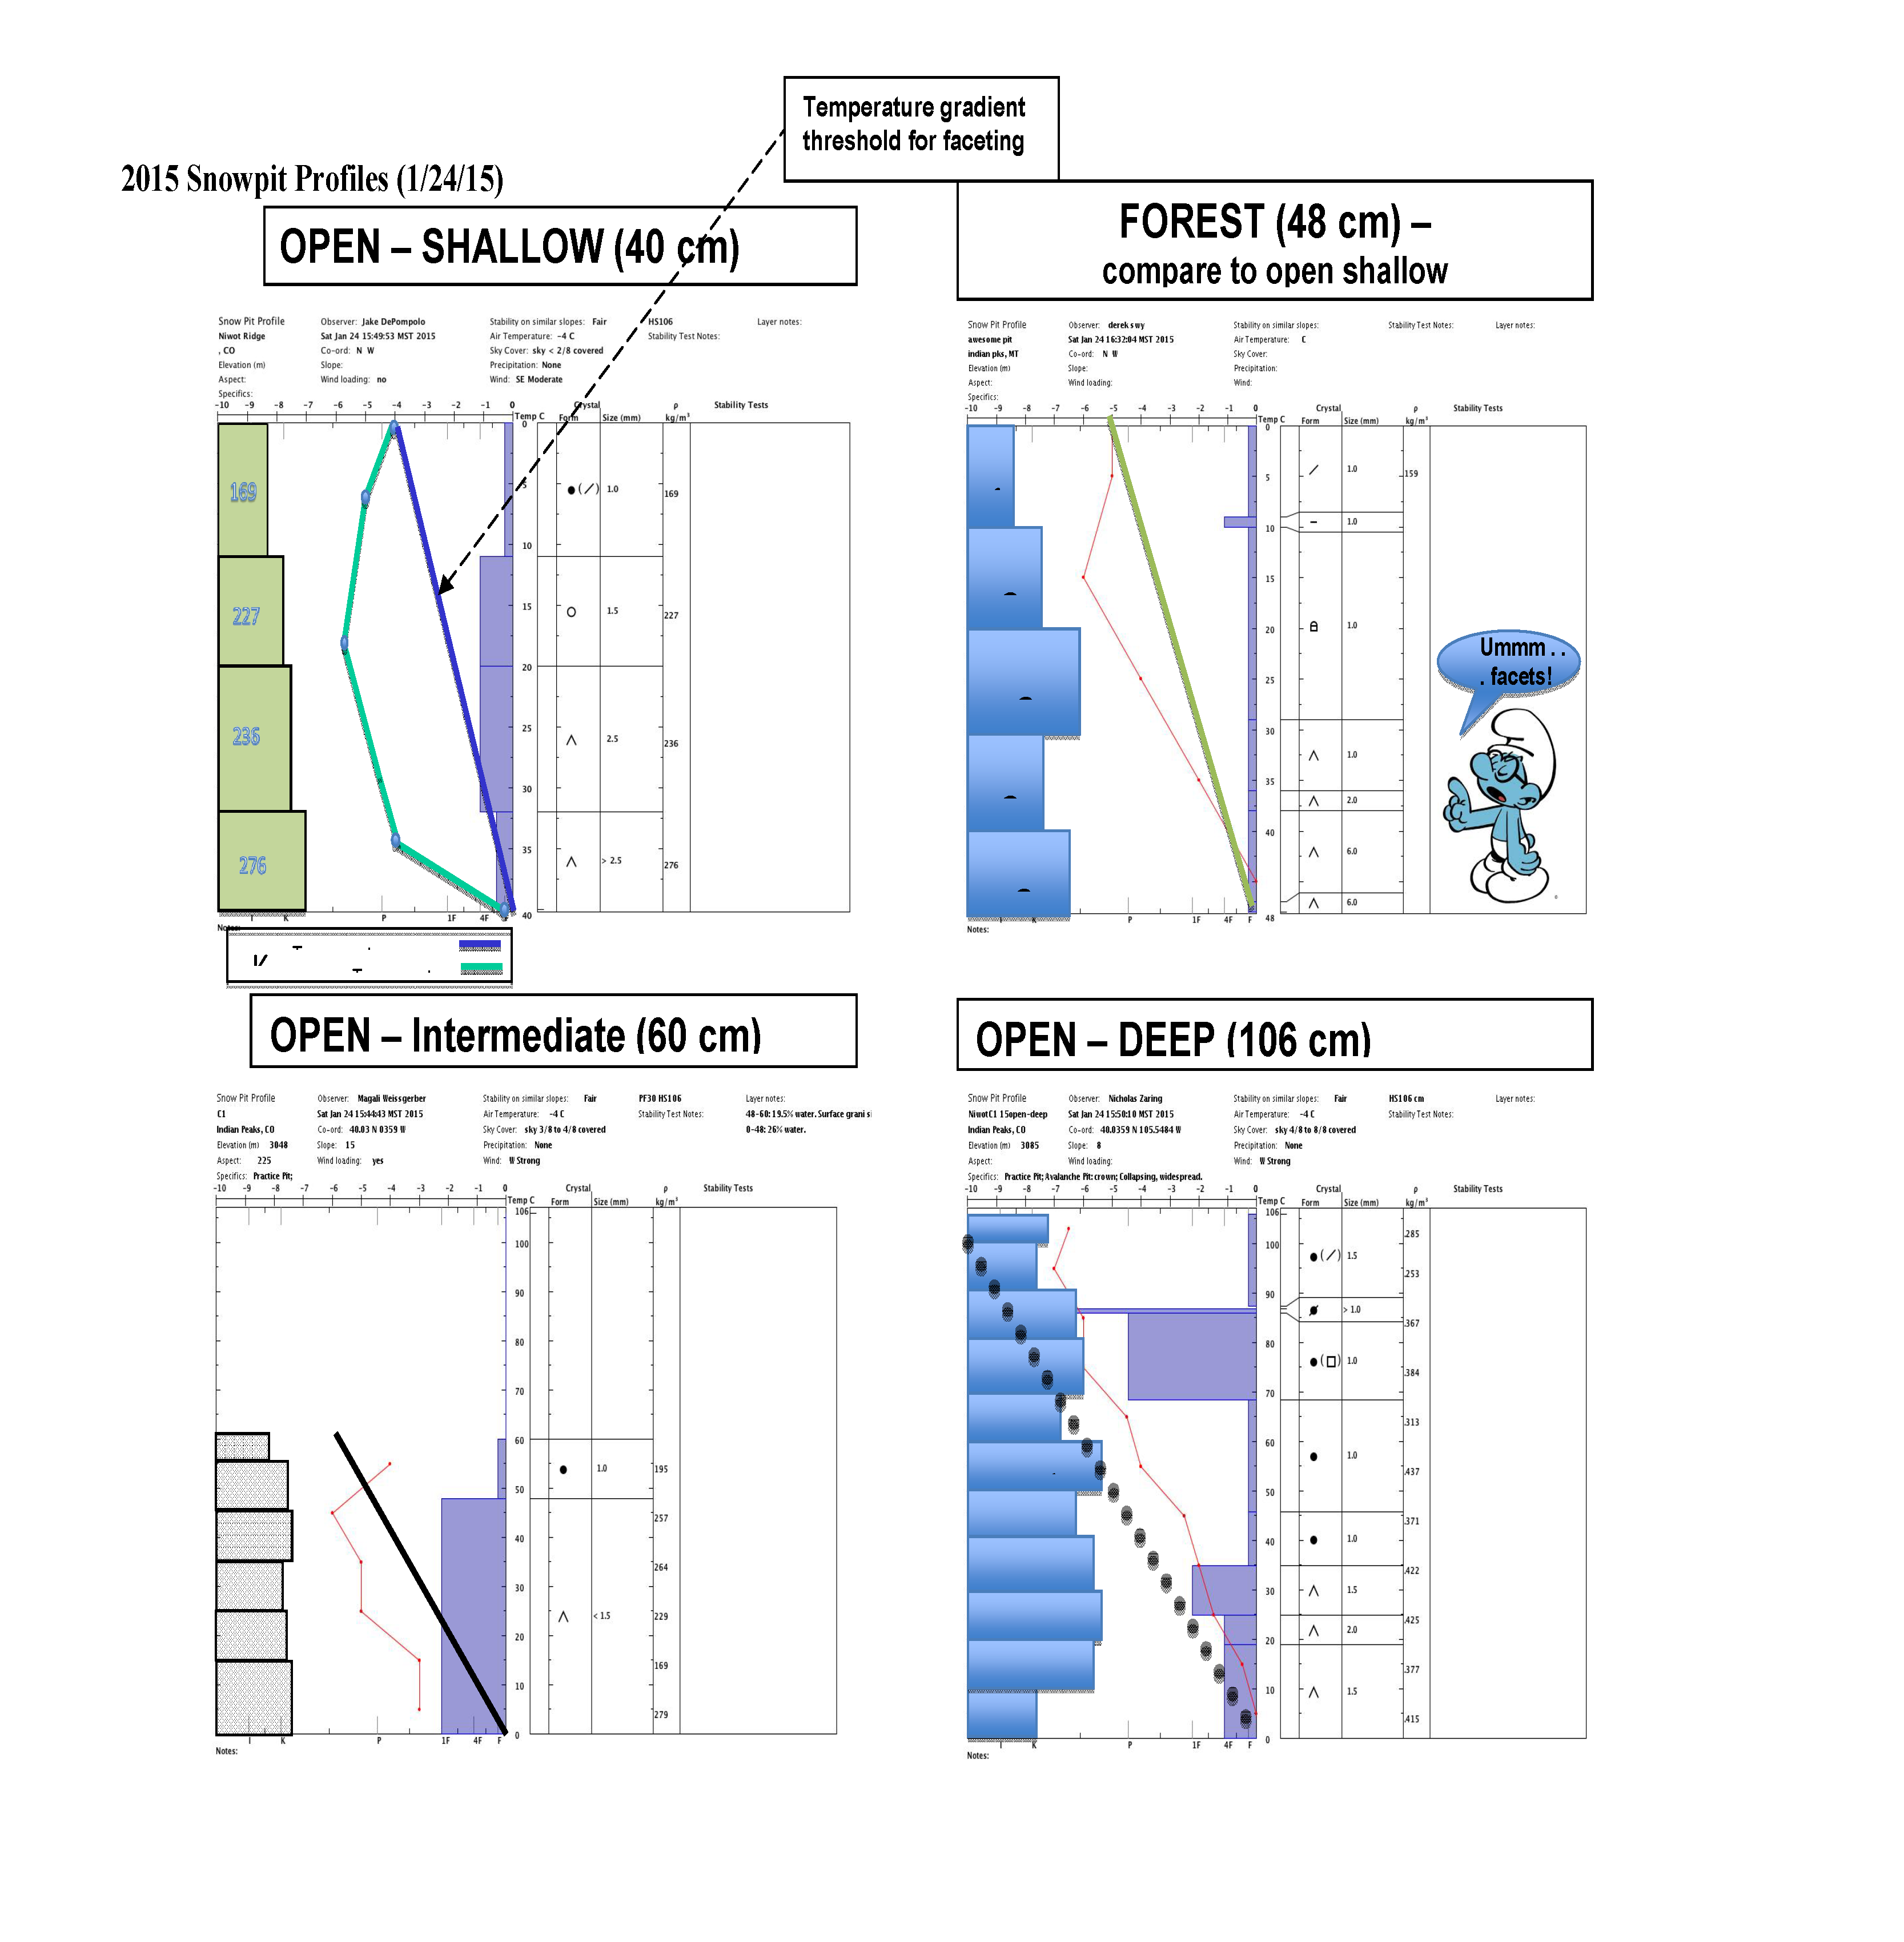
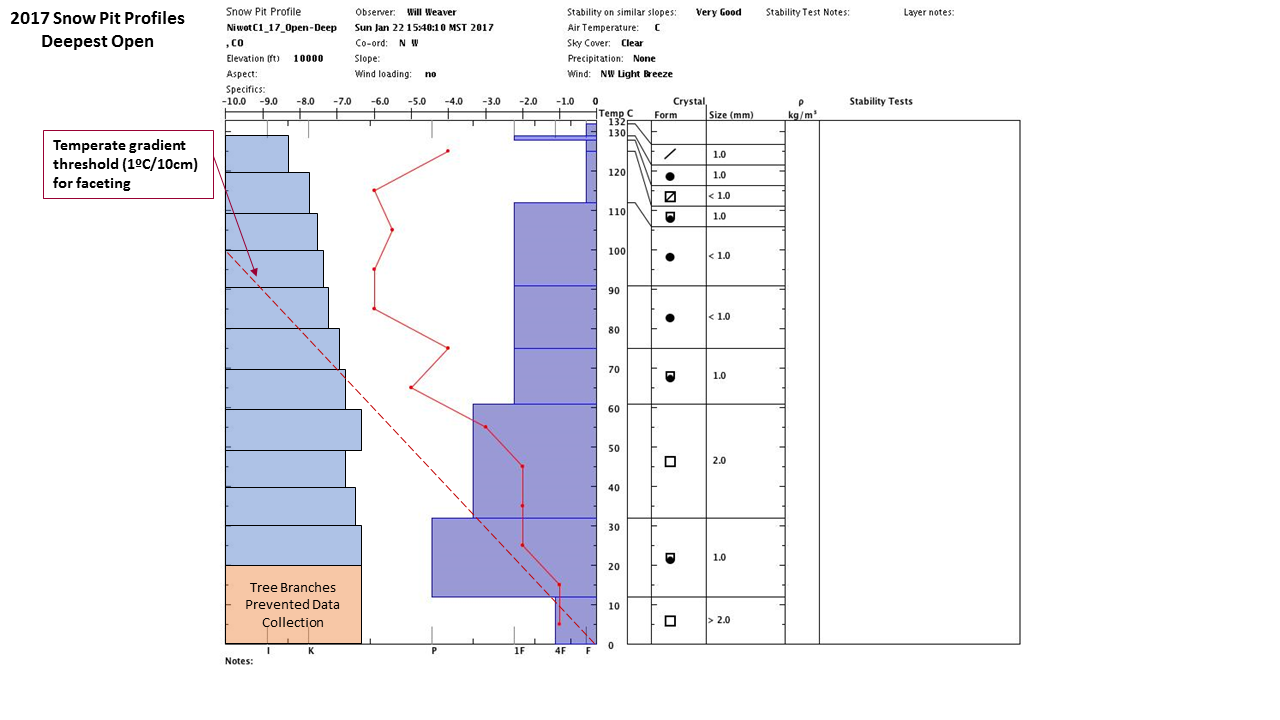
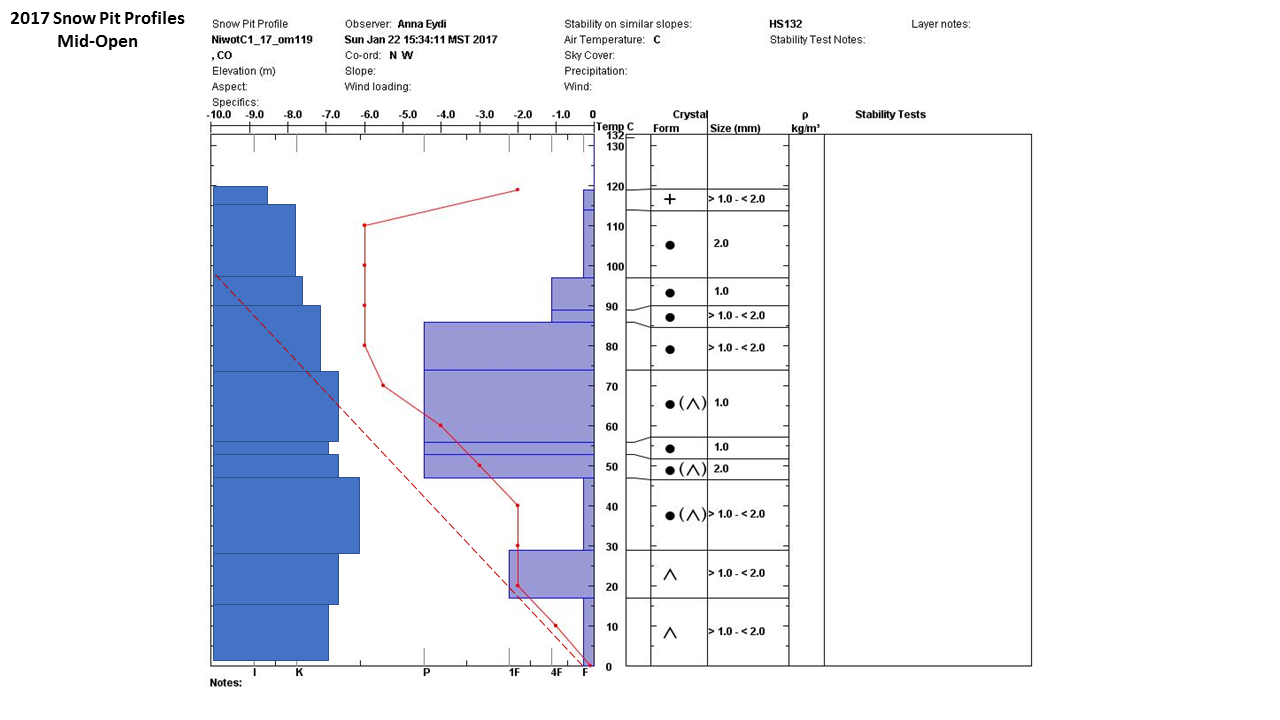
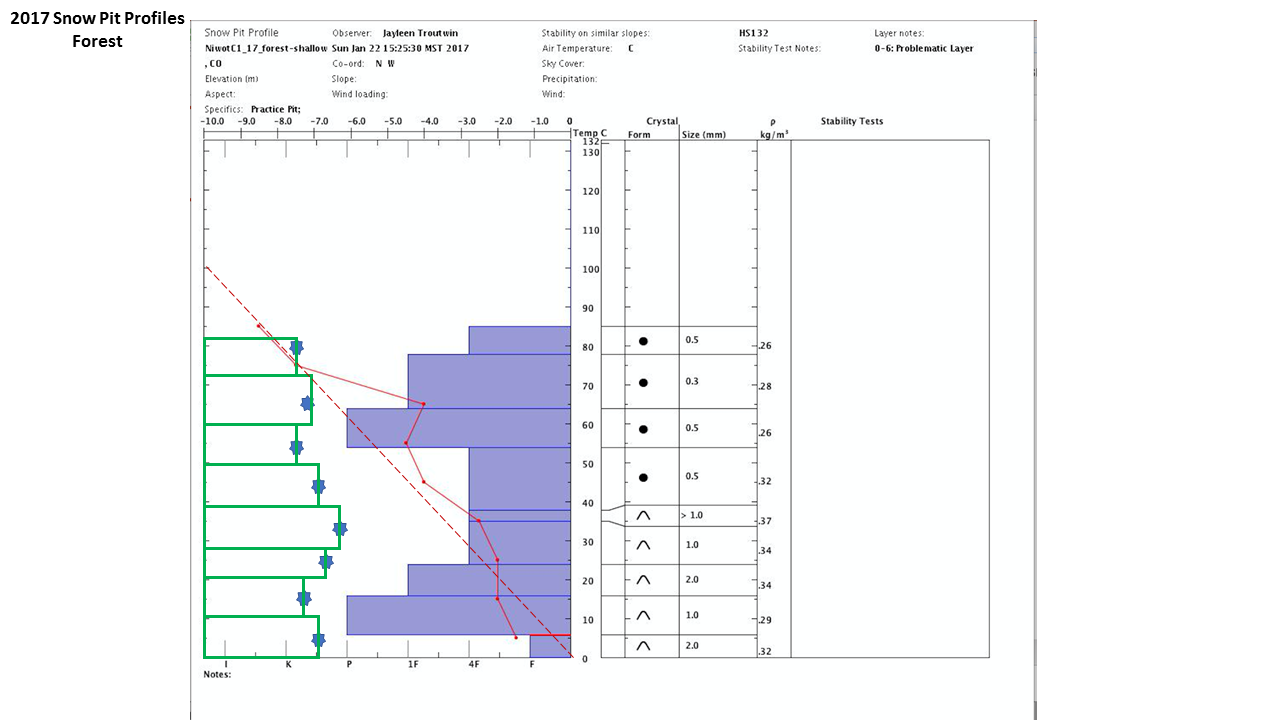
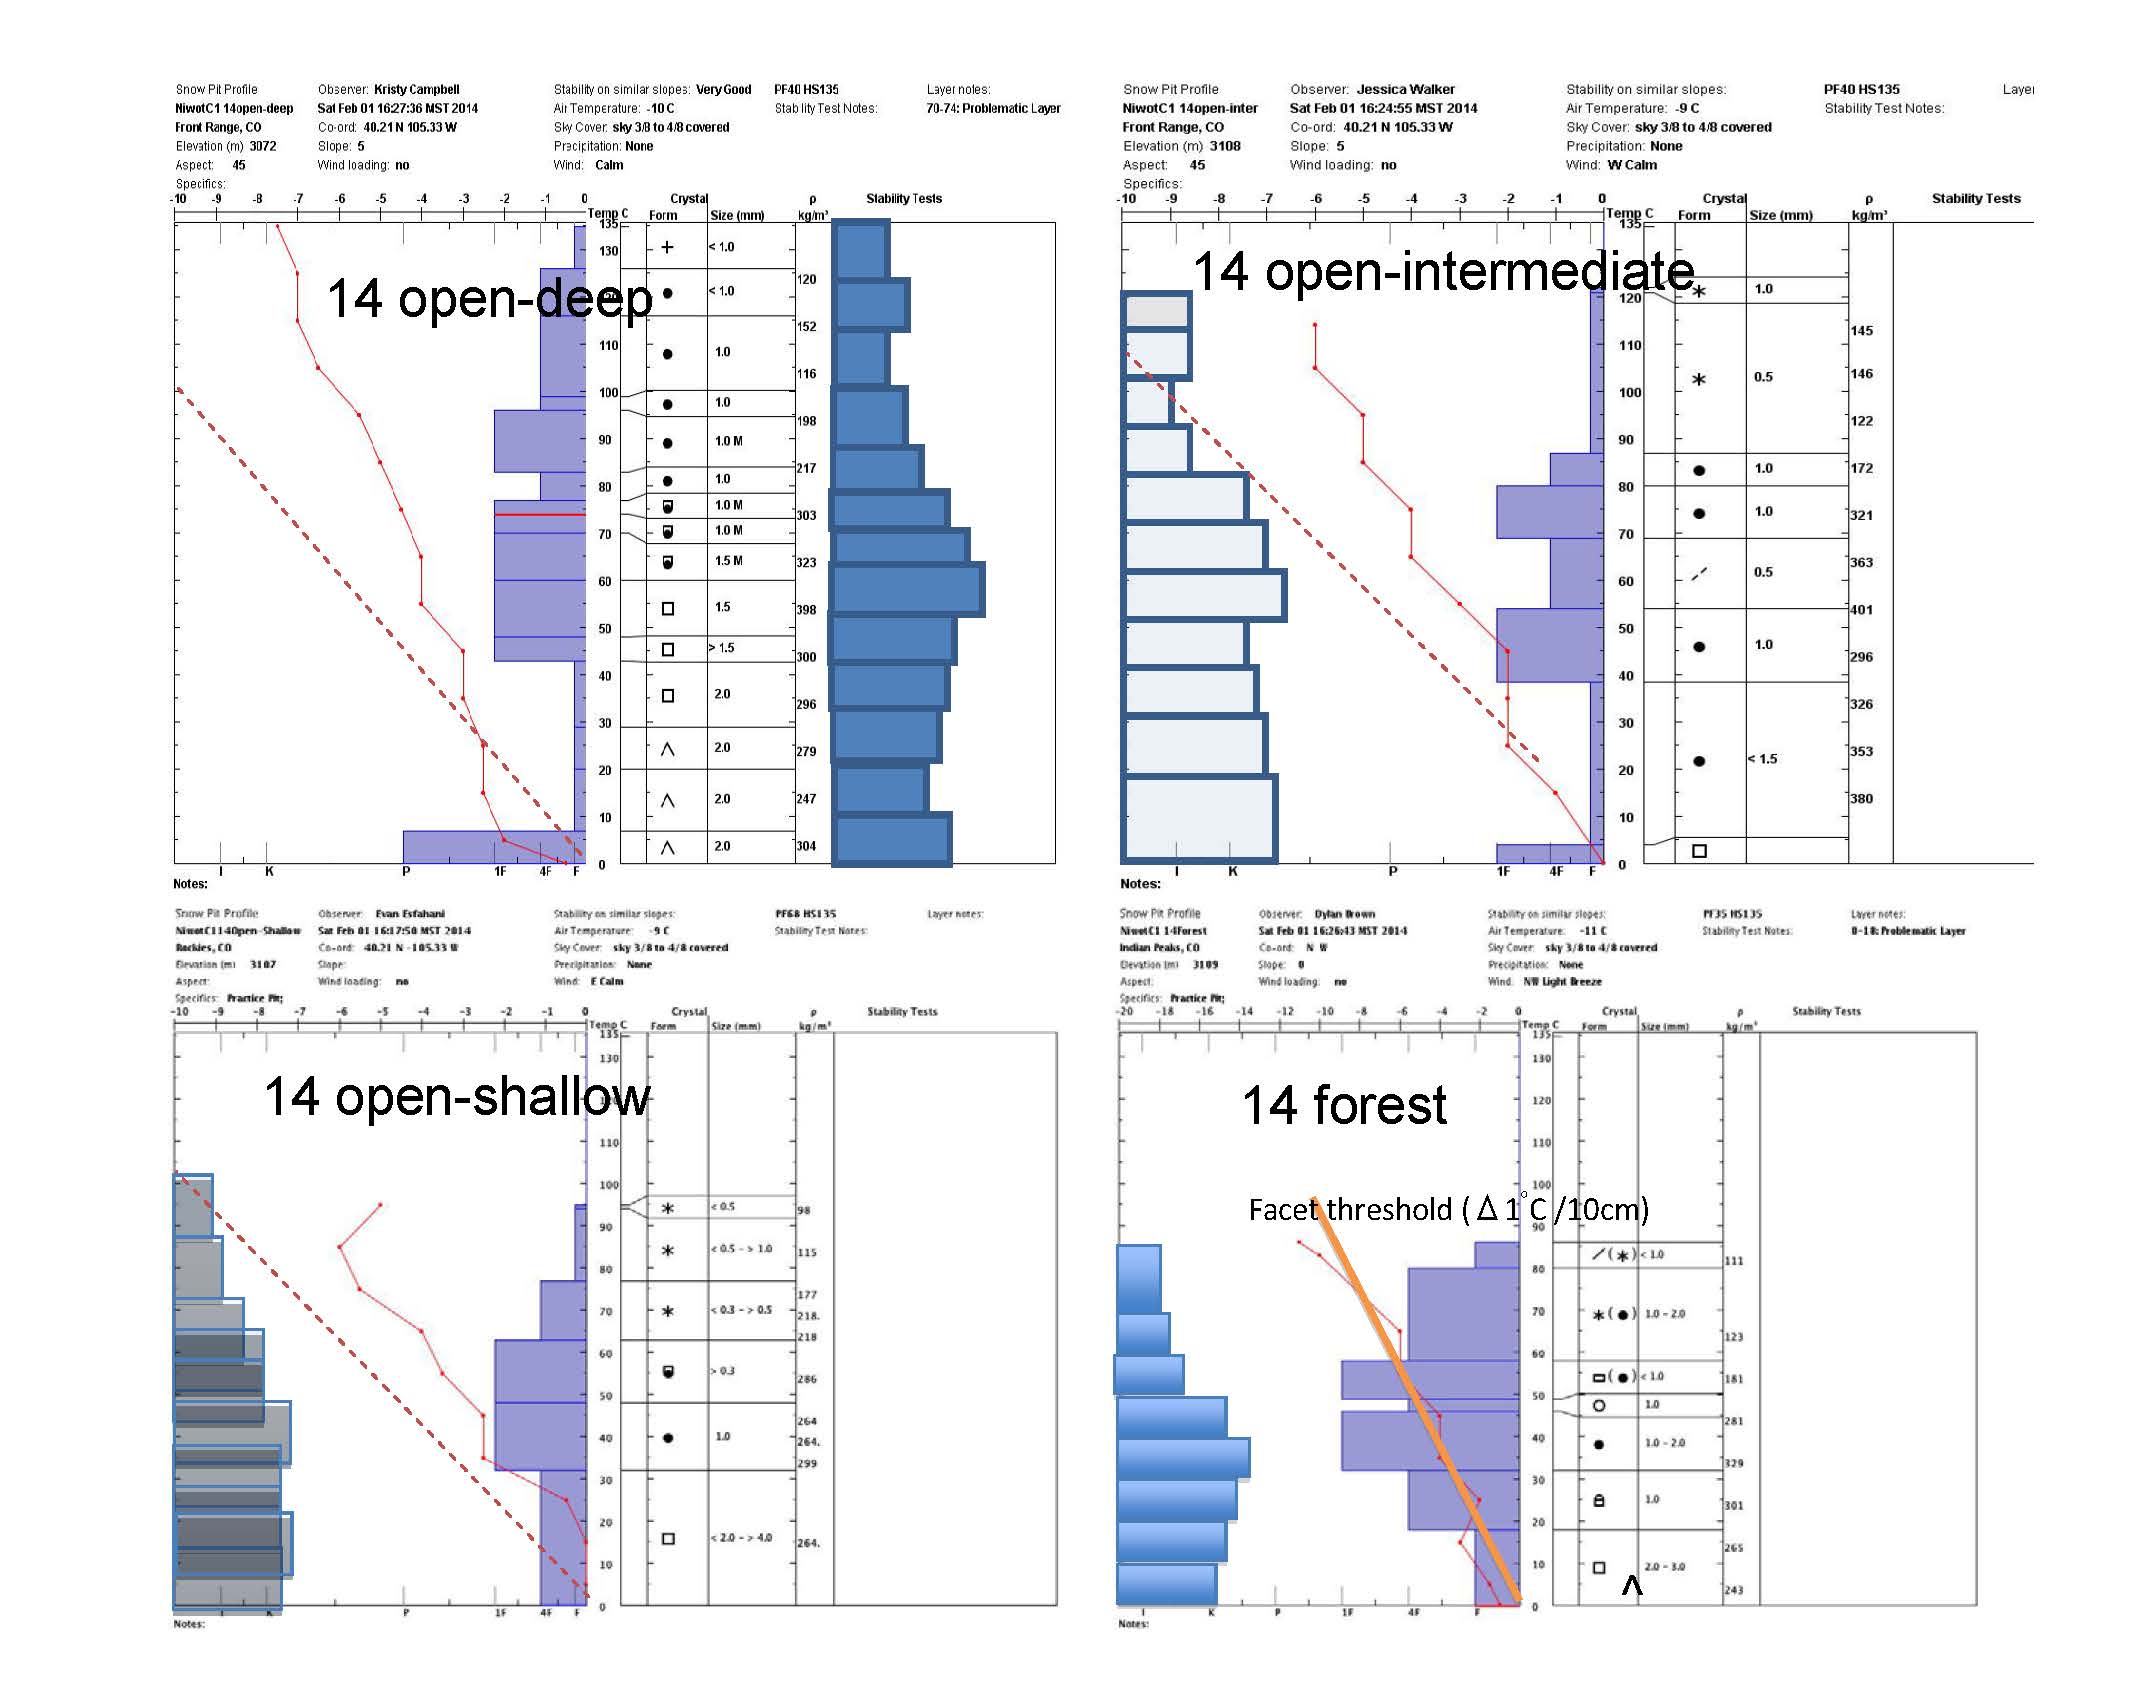
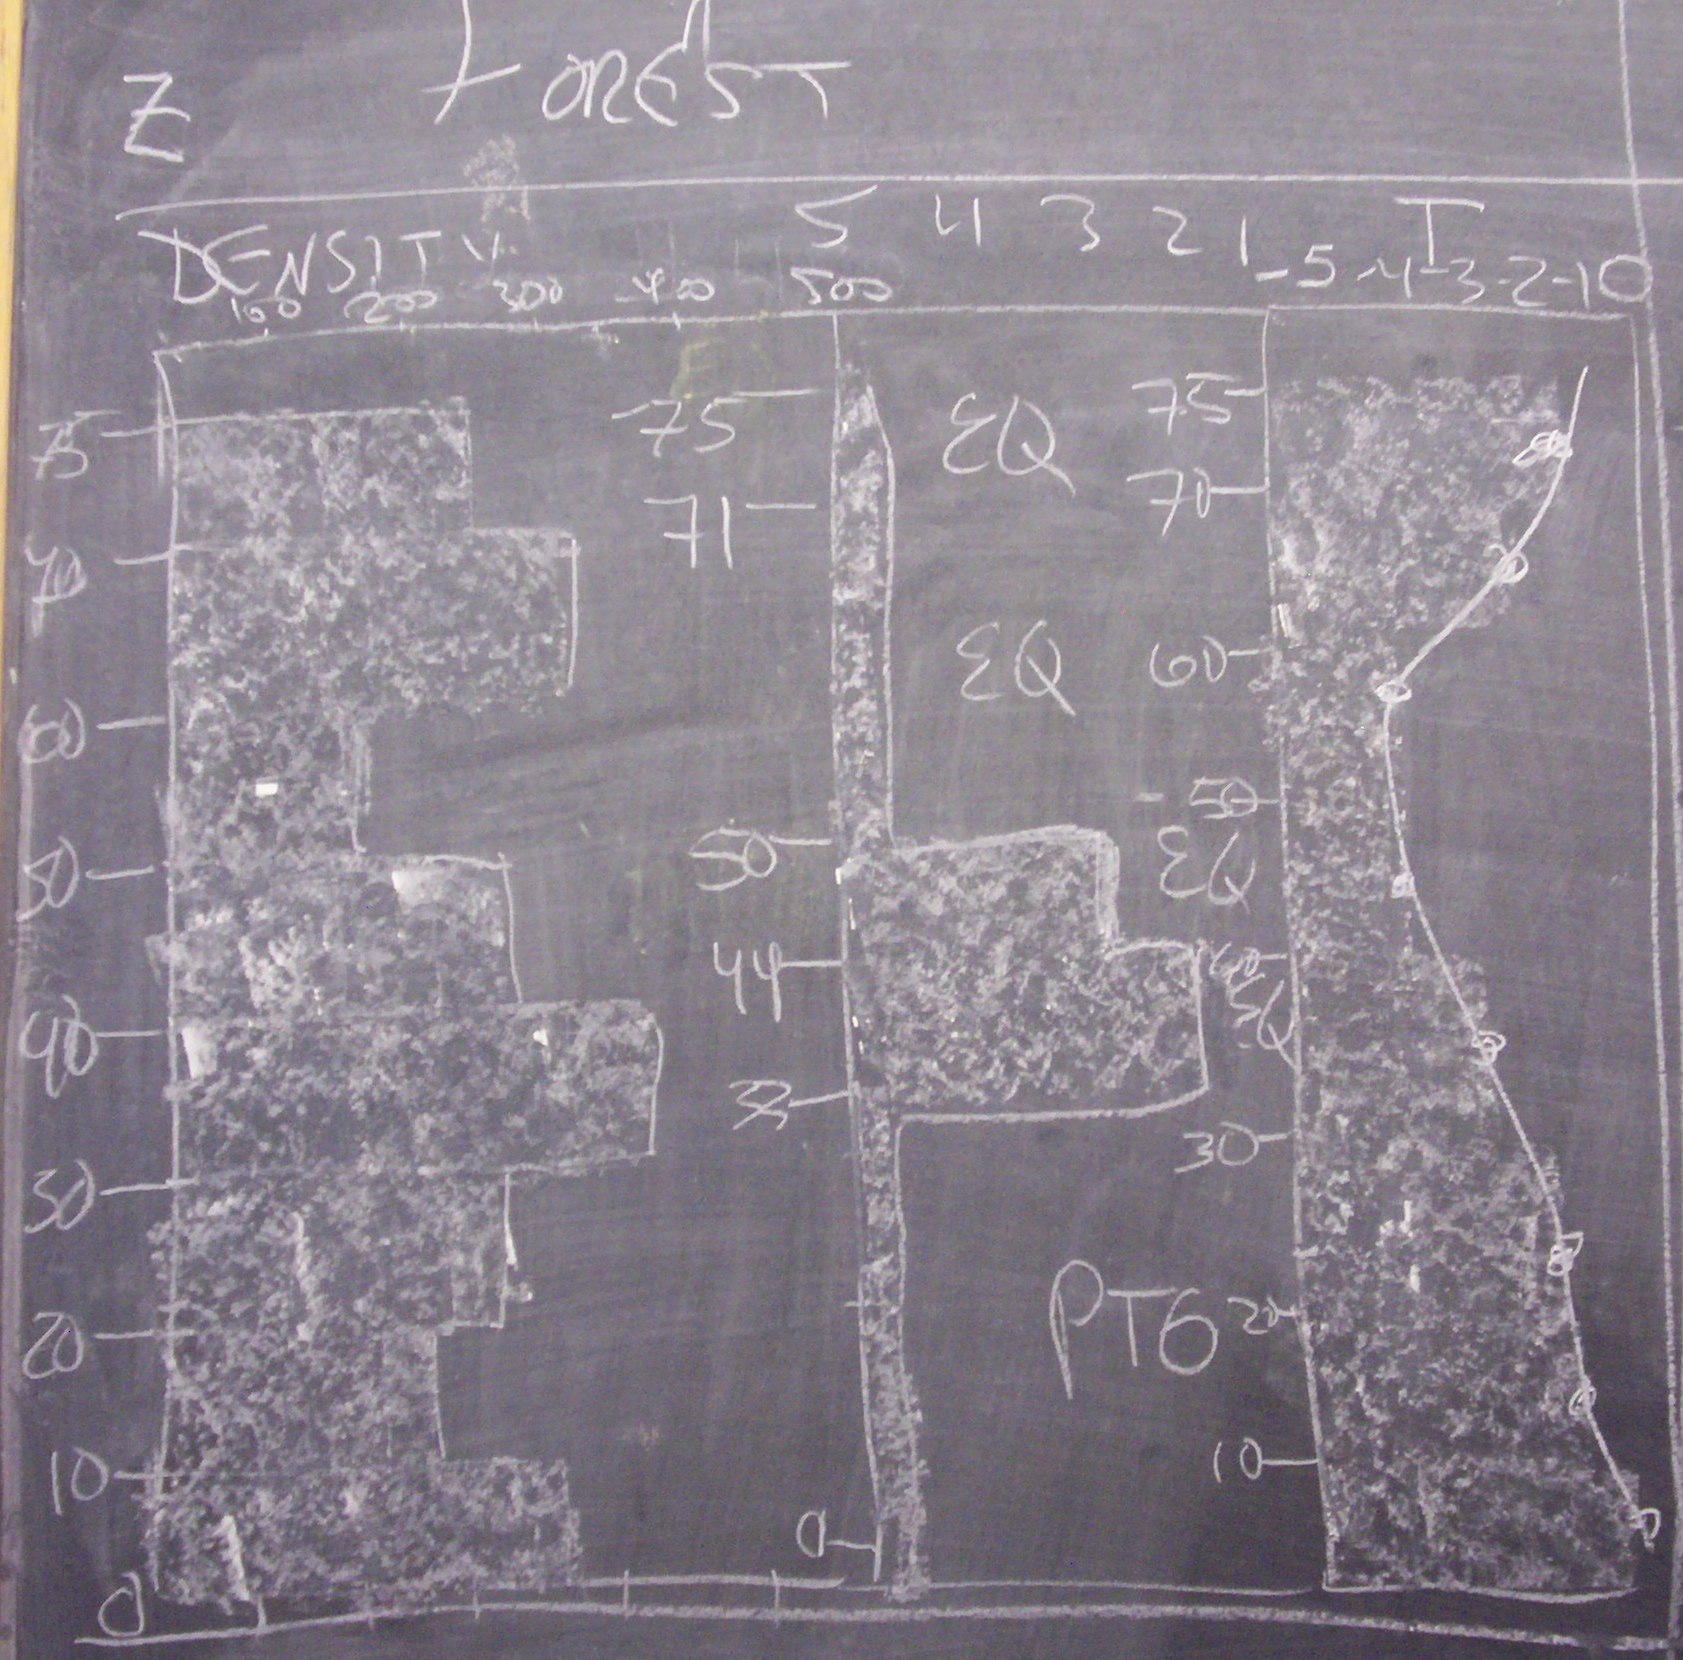
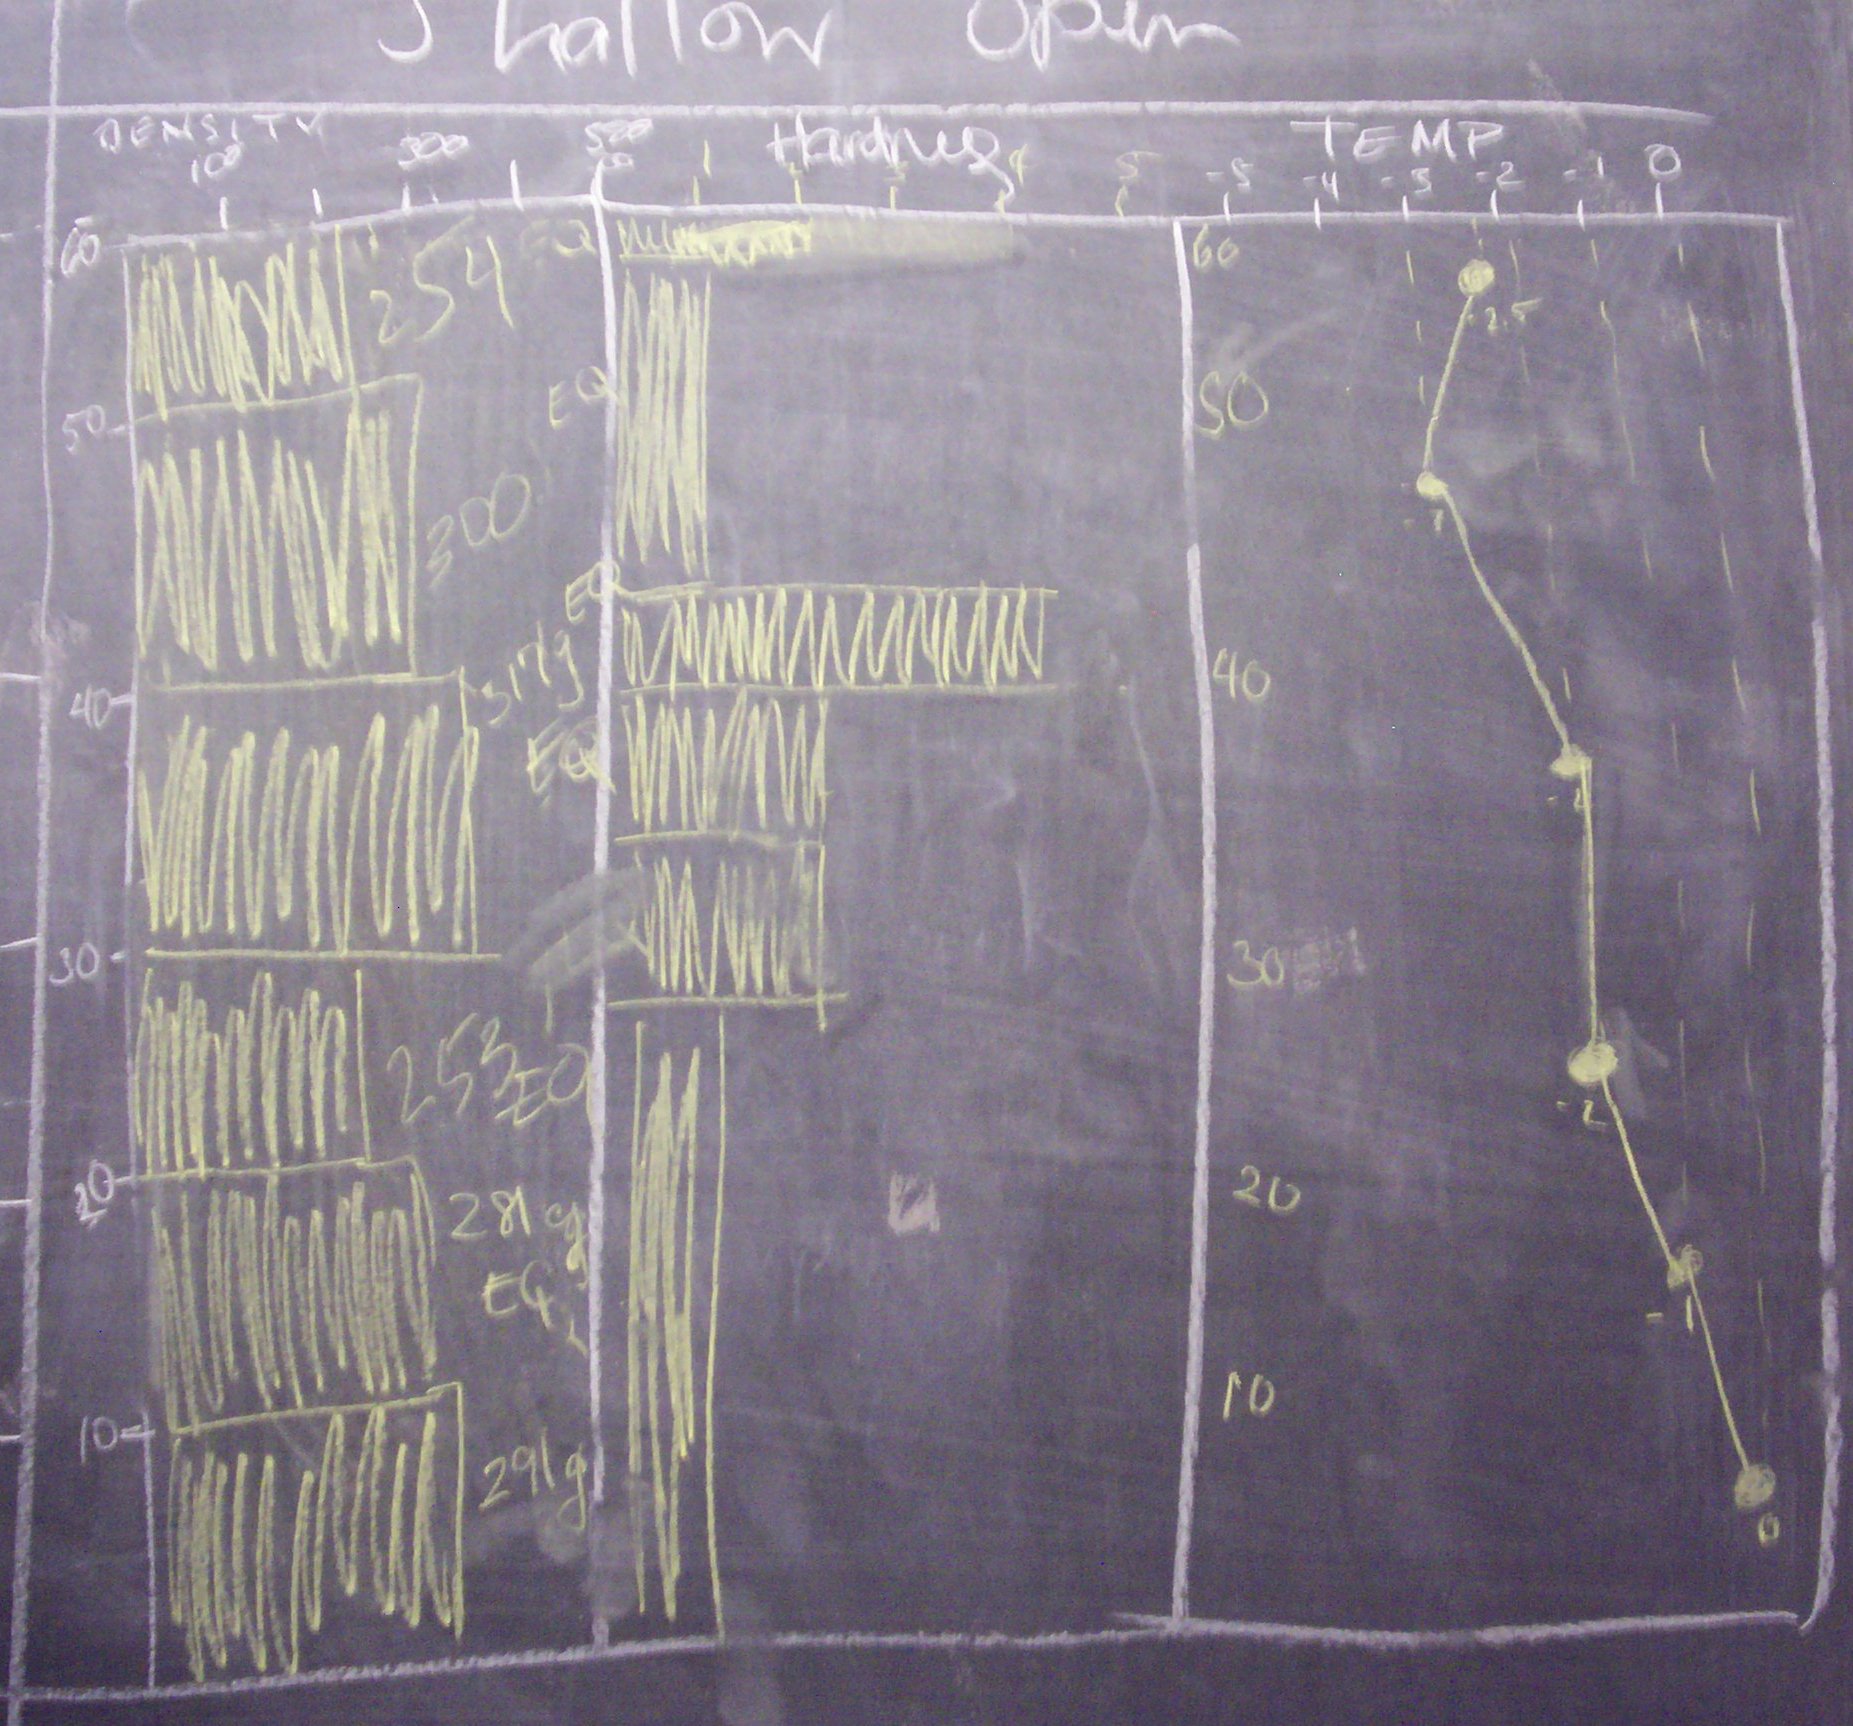
- Lower layers in "open-intermediate" were faceted, rather than rounded as indicated
- Dashed diagonal line (thick line, in
"forest" plot) show the 10decC/meter the
threshold for Temperature Gradient
processes.
- C1 Snotel & climate data (xls, 300k) -- composite image to the right
- Discussion
- Do you see a correspondence between
layers in your snowpits and weather
history (graph in right panel) of:
- Snowpack accumulation
- Consolidation (as shown by snowpack
depth and density)
- Melt periods, from Tmax and DTR (diurnal temperature range) record
- note: strong positive DTR
indicates periods of heating (why?)
- Periods of depth hoar formation (faceting), from Tmin (& Tmax) record
- See also
- Overall Lessons Points re snow
- Lesson Points for the snowpack field activity
- Discussion under 2013 Results
- Snowpack profiles - composite image (image below) & individual plots (pdf, 600k)
- Lower layers in "open-intermediate" were faceted, rather than rounded as indicated
- Dashed diagonal line (thick line, in
"forest" plot) show the 10decC/meter the
threshold for Temperature Gradient
processes.
- C1 Snotel & climate data (xls, 300k) -- composite image to the right
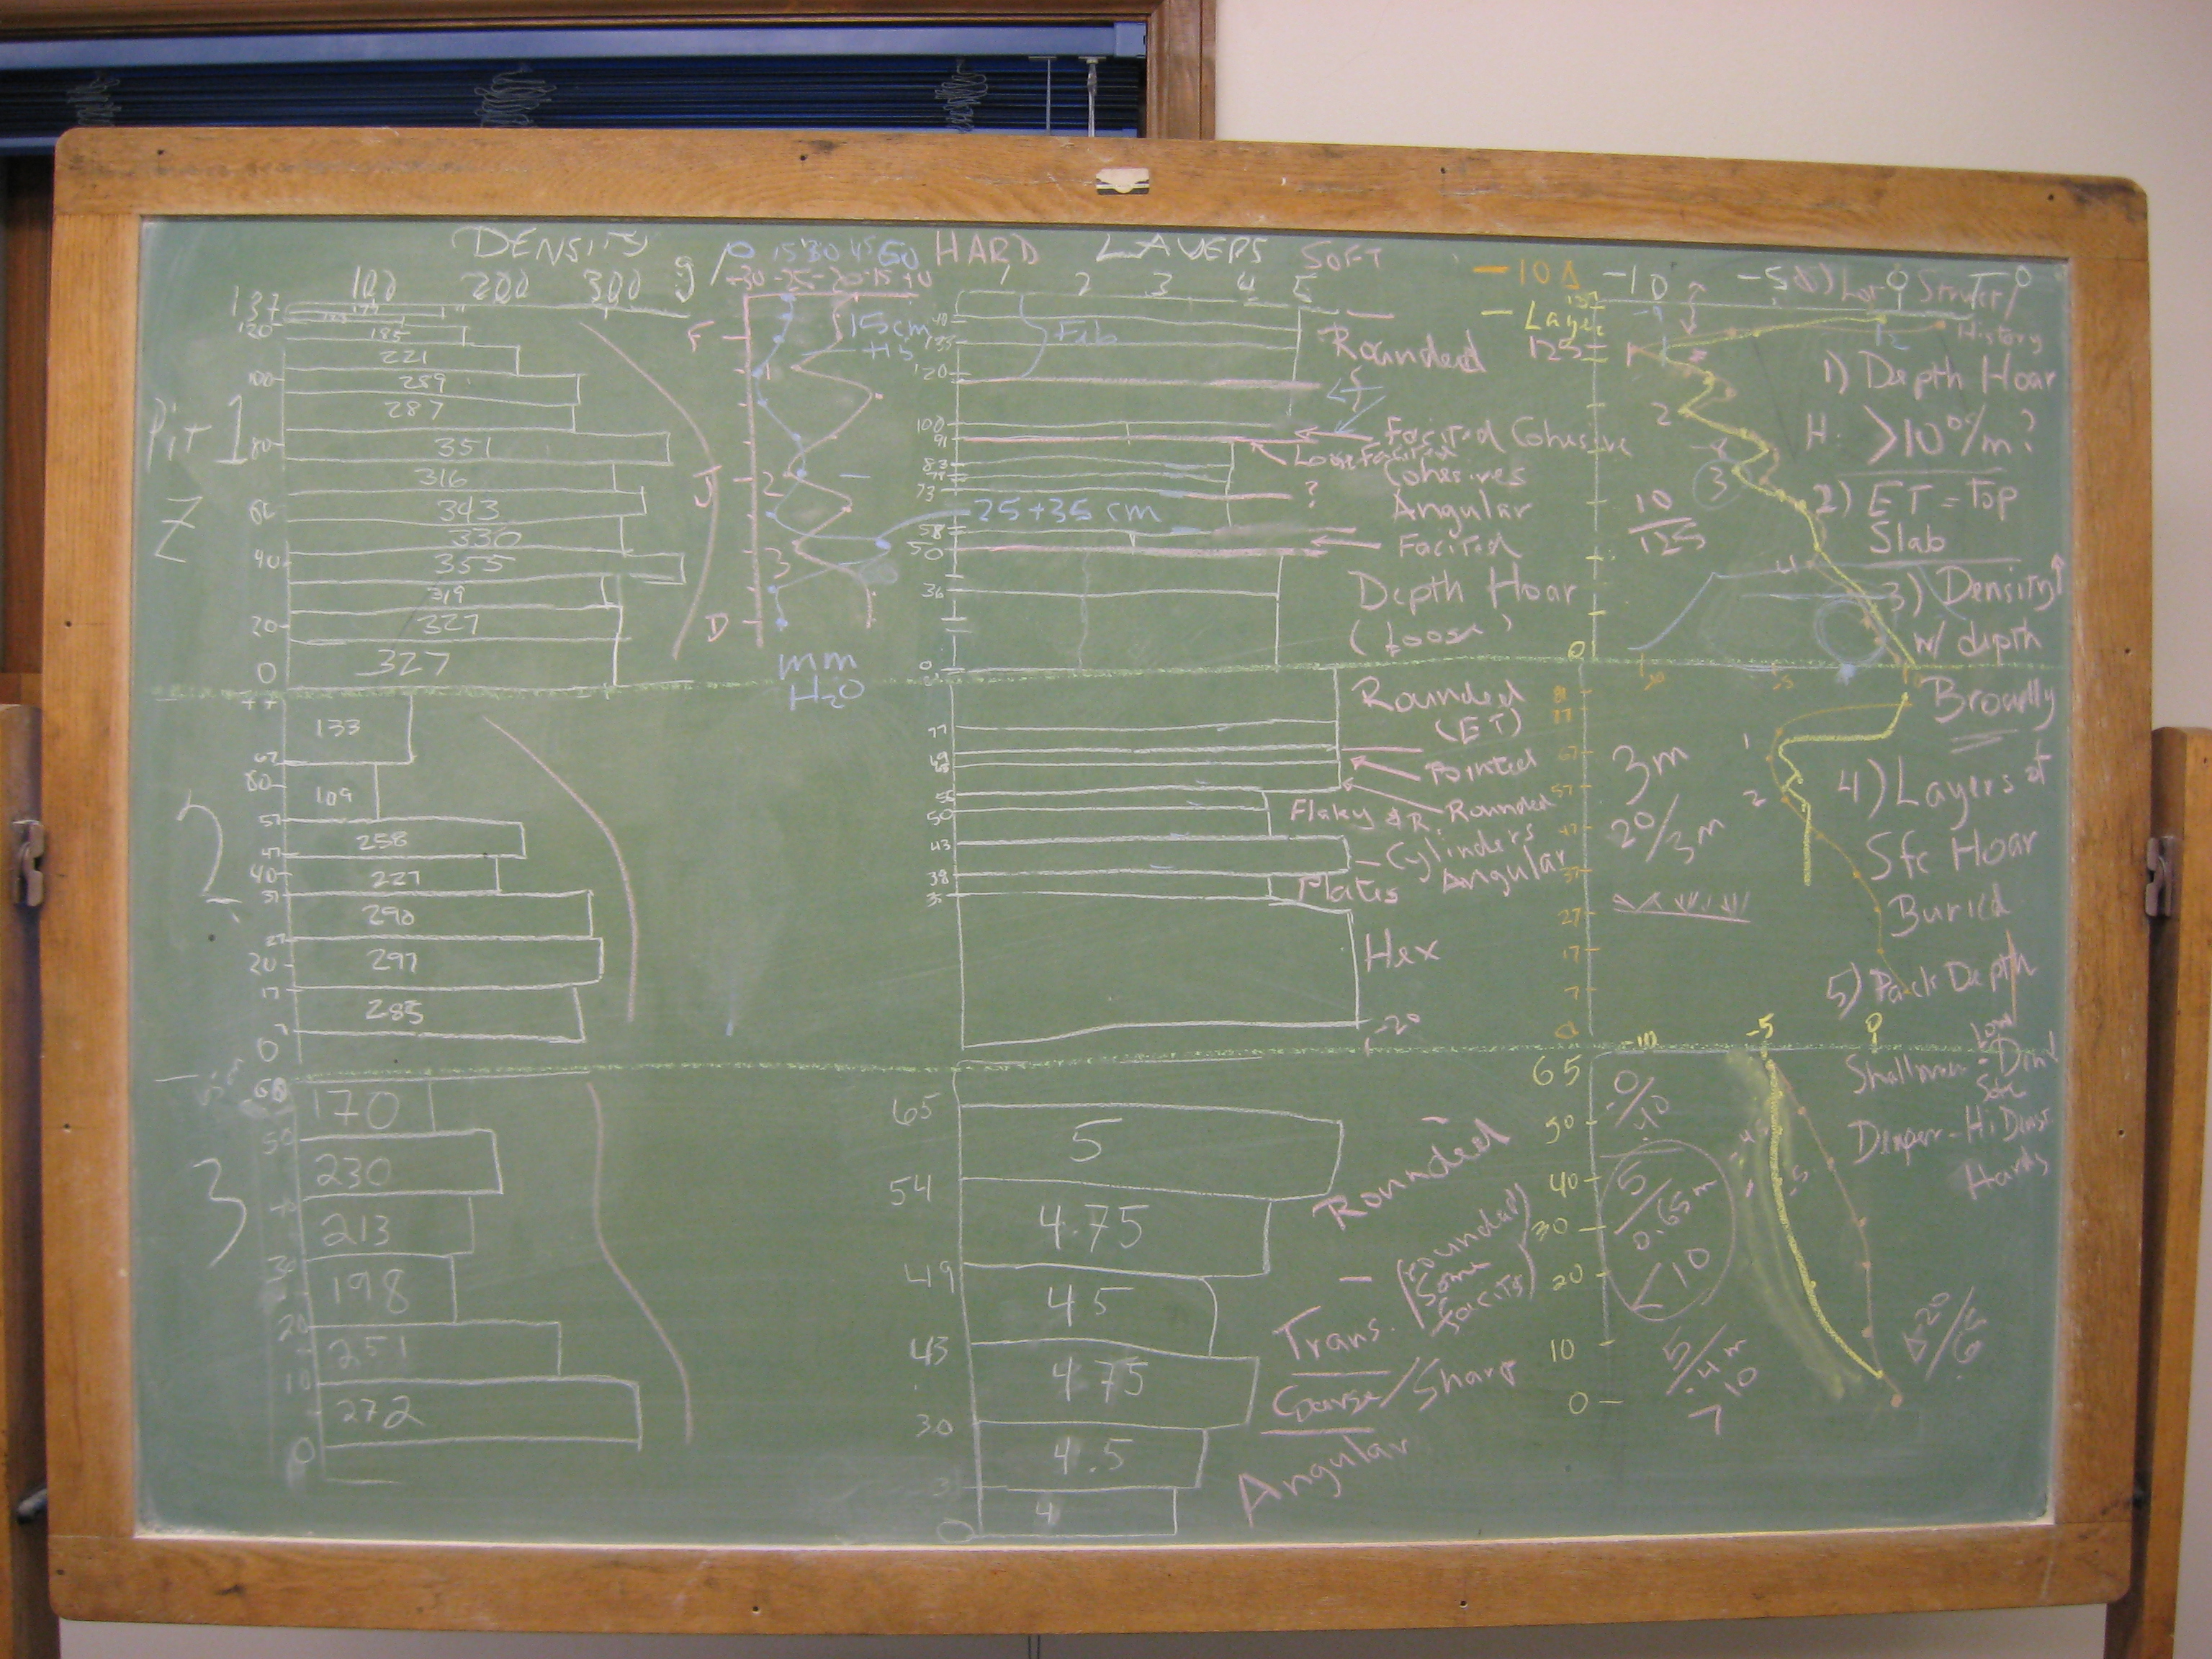
- Can you find a 1:1 correspondence between the layers in the Pit Profiles and the Precipitation record?
- Once you've given it a go, see one
interpretation: (pdf,
70k)
- Or are some layers missing or others
less certain, and why? Be sure to
look at the Temperature record at the
same time.
- See Discussion under 2013
- Snowpack profile
- Annotated profile graph and C1 Snotel & climate data (pdf, 1M)
- Discussion --
-
Can
you interpret the pit results with
respect to precipitation and
temperature records?
- Such as, the occurrence of and changes in:
- Layers
- TG snow
- Crusts
- What can you
deduce from the temperature
profiles? Such as:
- What has been the magnitude
of the nighttime snowpack T
gradient (using Tmin
values)?
- And with what
consequences for the pack?
- And the daytime near-surface daytime snowpack T gradient?
- With what consequences?
- Refer back to the topic's Lessons Points - and those for the exercise
-
Can
you interpret the pit results with
respect to precipitation and
temperature records?
- Datasheets
(pdf,
1M)
- Winter
weather
record up through Snowpit day (pdf,
200k; xls,
300k)
- C1 new snowfall, precipitation, and temperature record - from Jen Morse
- Snowpack profile
- Profile graph and C1 Snotel &
climate data (pdf,
160k)
-
Can
you interpret the pit results with
respect to precipitation and
temperature records? Such
as:
- Occurrence of
- TG, ET, WM snow
- Crusts
- Layers
-
Can
you interpret the pit results with
respect to precipitation and
temperature records? Such
as:
- Datasheets
(pdf, 1M)
- Winter
weather
record up through Snowpit day (pdf
, 400k)
- C1
new snowfall, precipitation, and
temperature record - from Jen Morse
- Day's
photos by Brian Inglis - https://www.facebook.com/media/set/?set=a.2880773093268.2132050.1078260082&type=1&l=ea5401c149
- Snowpack profile datasheets (pdf, 700k)
- Winter weather record up through Snowpit day (pdf , 400k)
- C1 new snowfall, precipitation, and temperature record - from Kurt Chowanski
- Note:
The last 2 pages ask for your
interpretation
- Results composite handout (pdf)
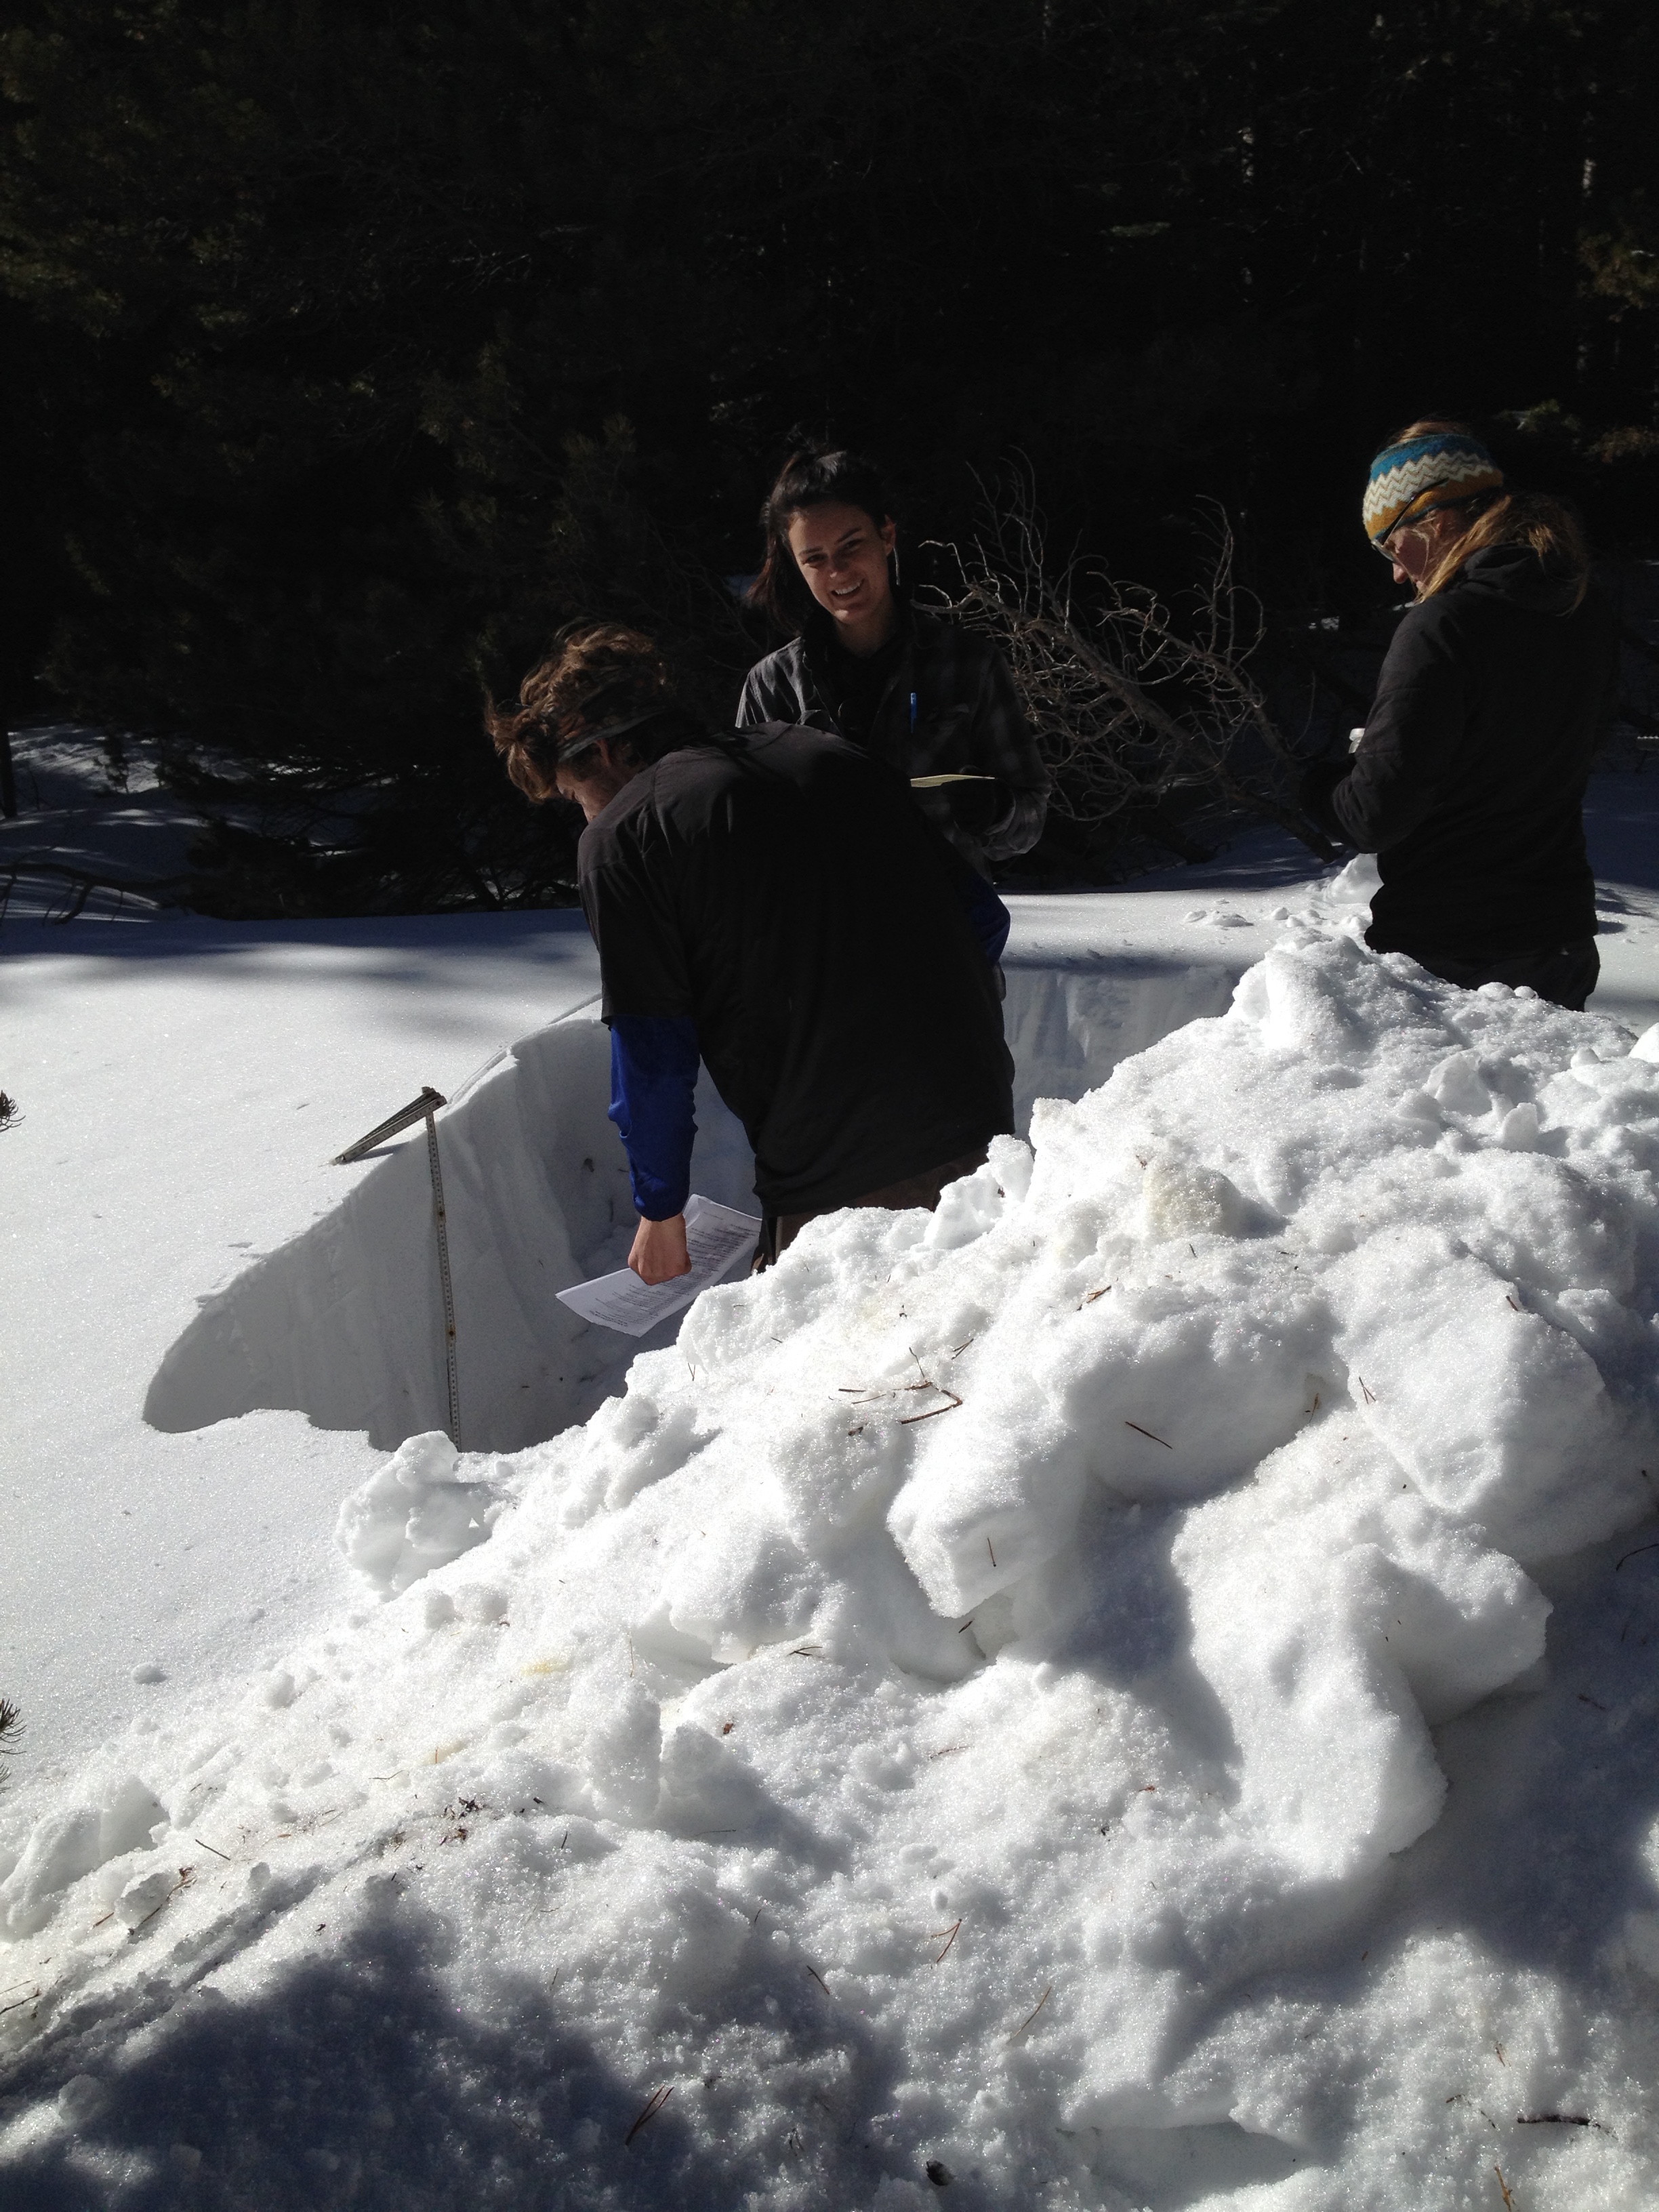
- Selected
snowpit
pix:
- Snowpack profile datasheets (pdf, 700k)
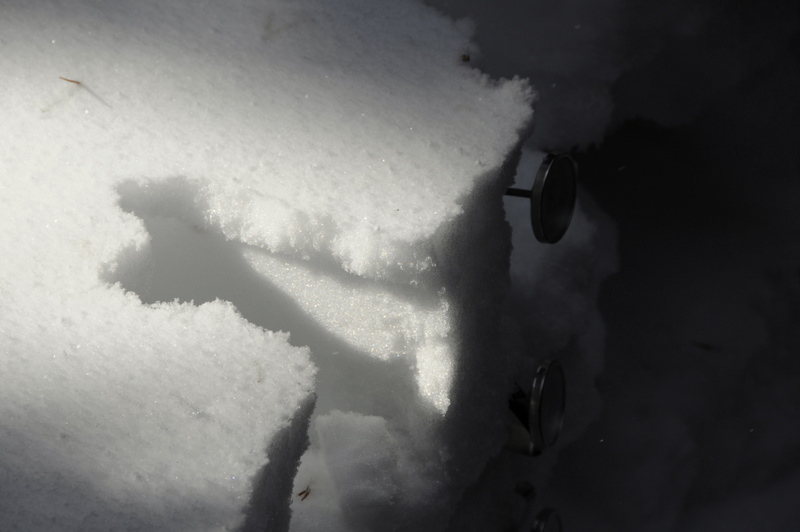
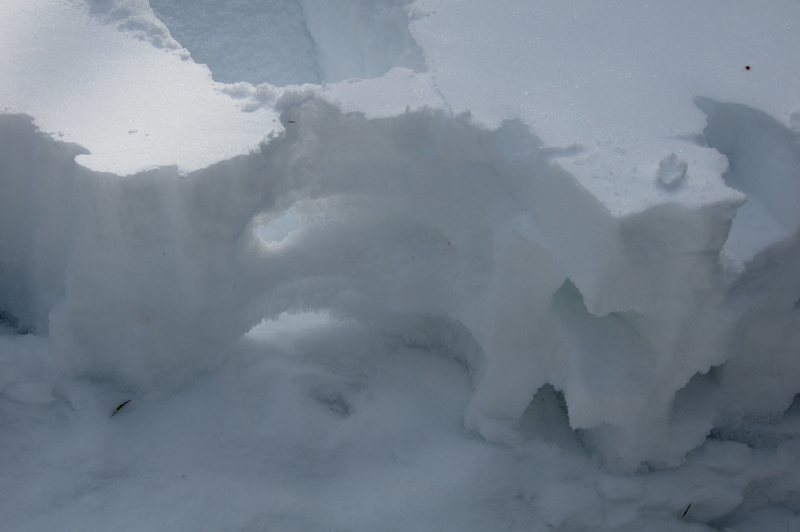
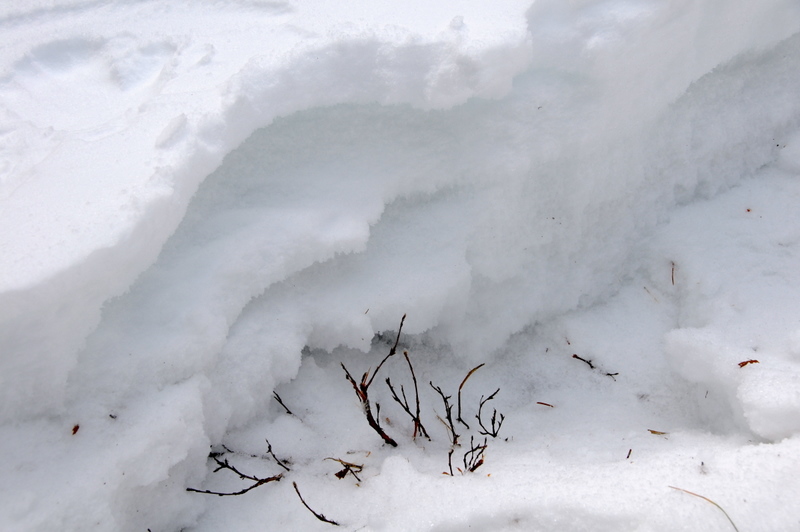
- Snowpack layers pix (jpg's, ~200k)
- Forest sfc layer
- Opening--
- deep site#1
conditions
- mid site#2 layers & crystals
- shallow site#3 layers
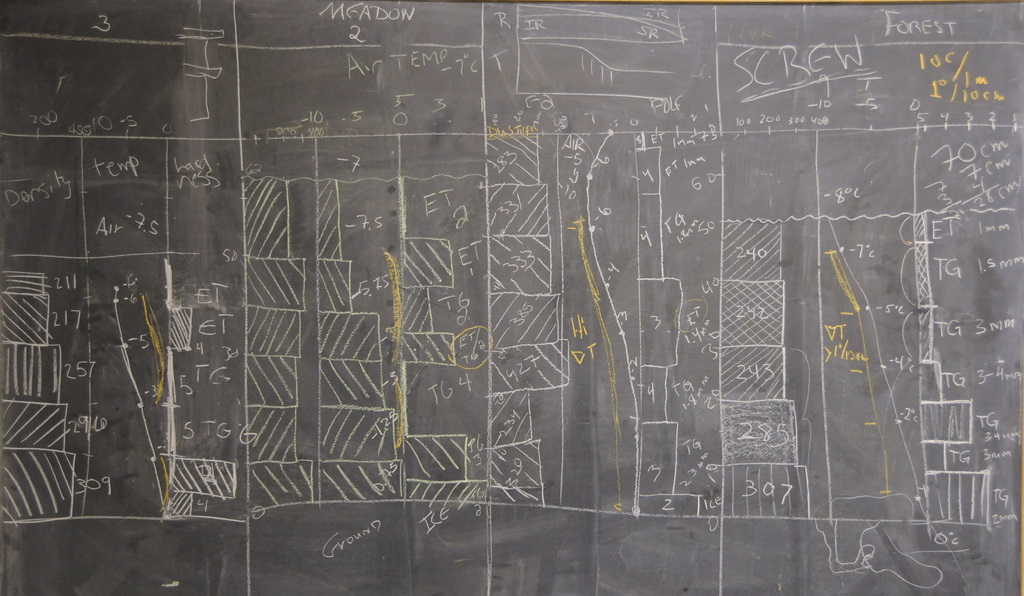
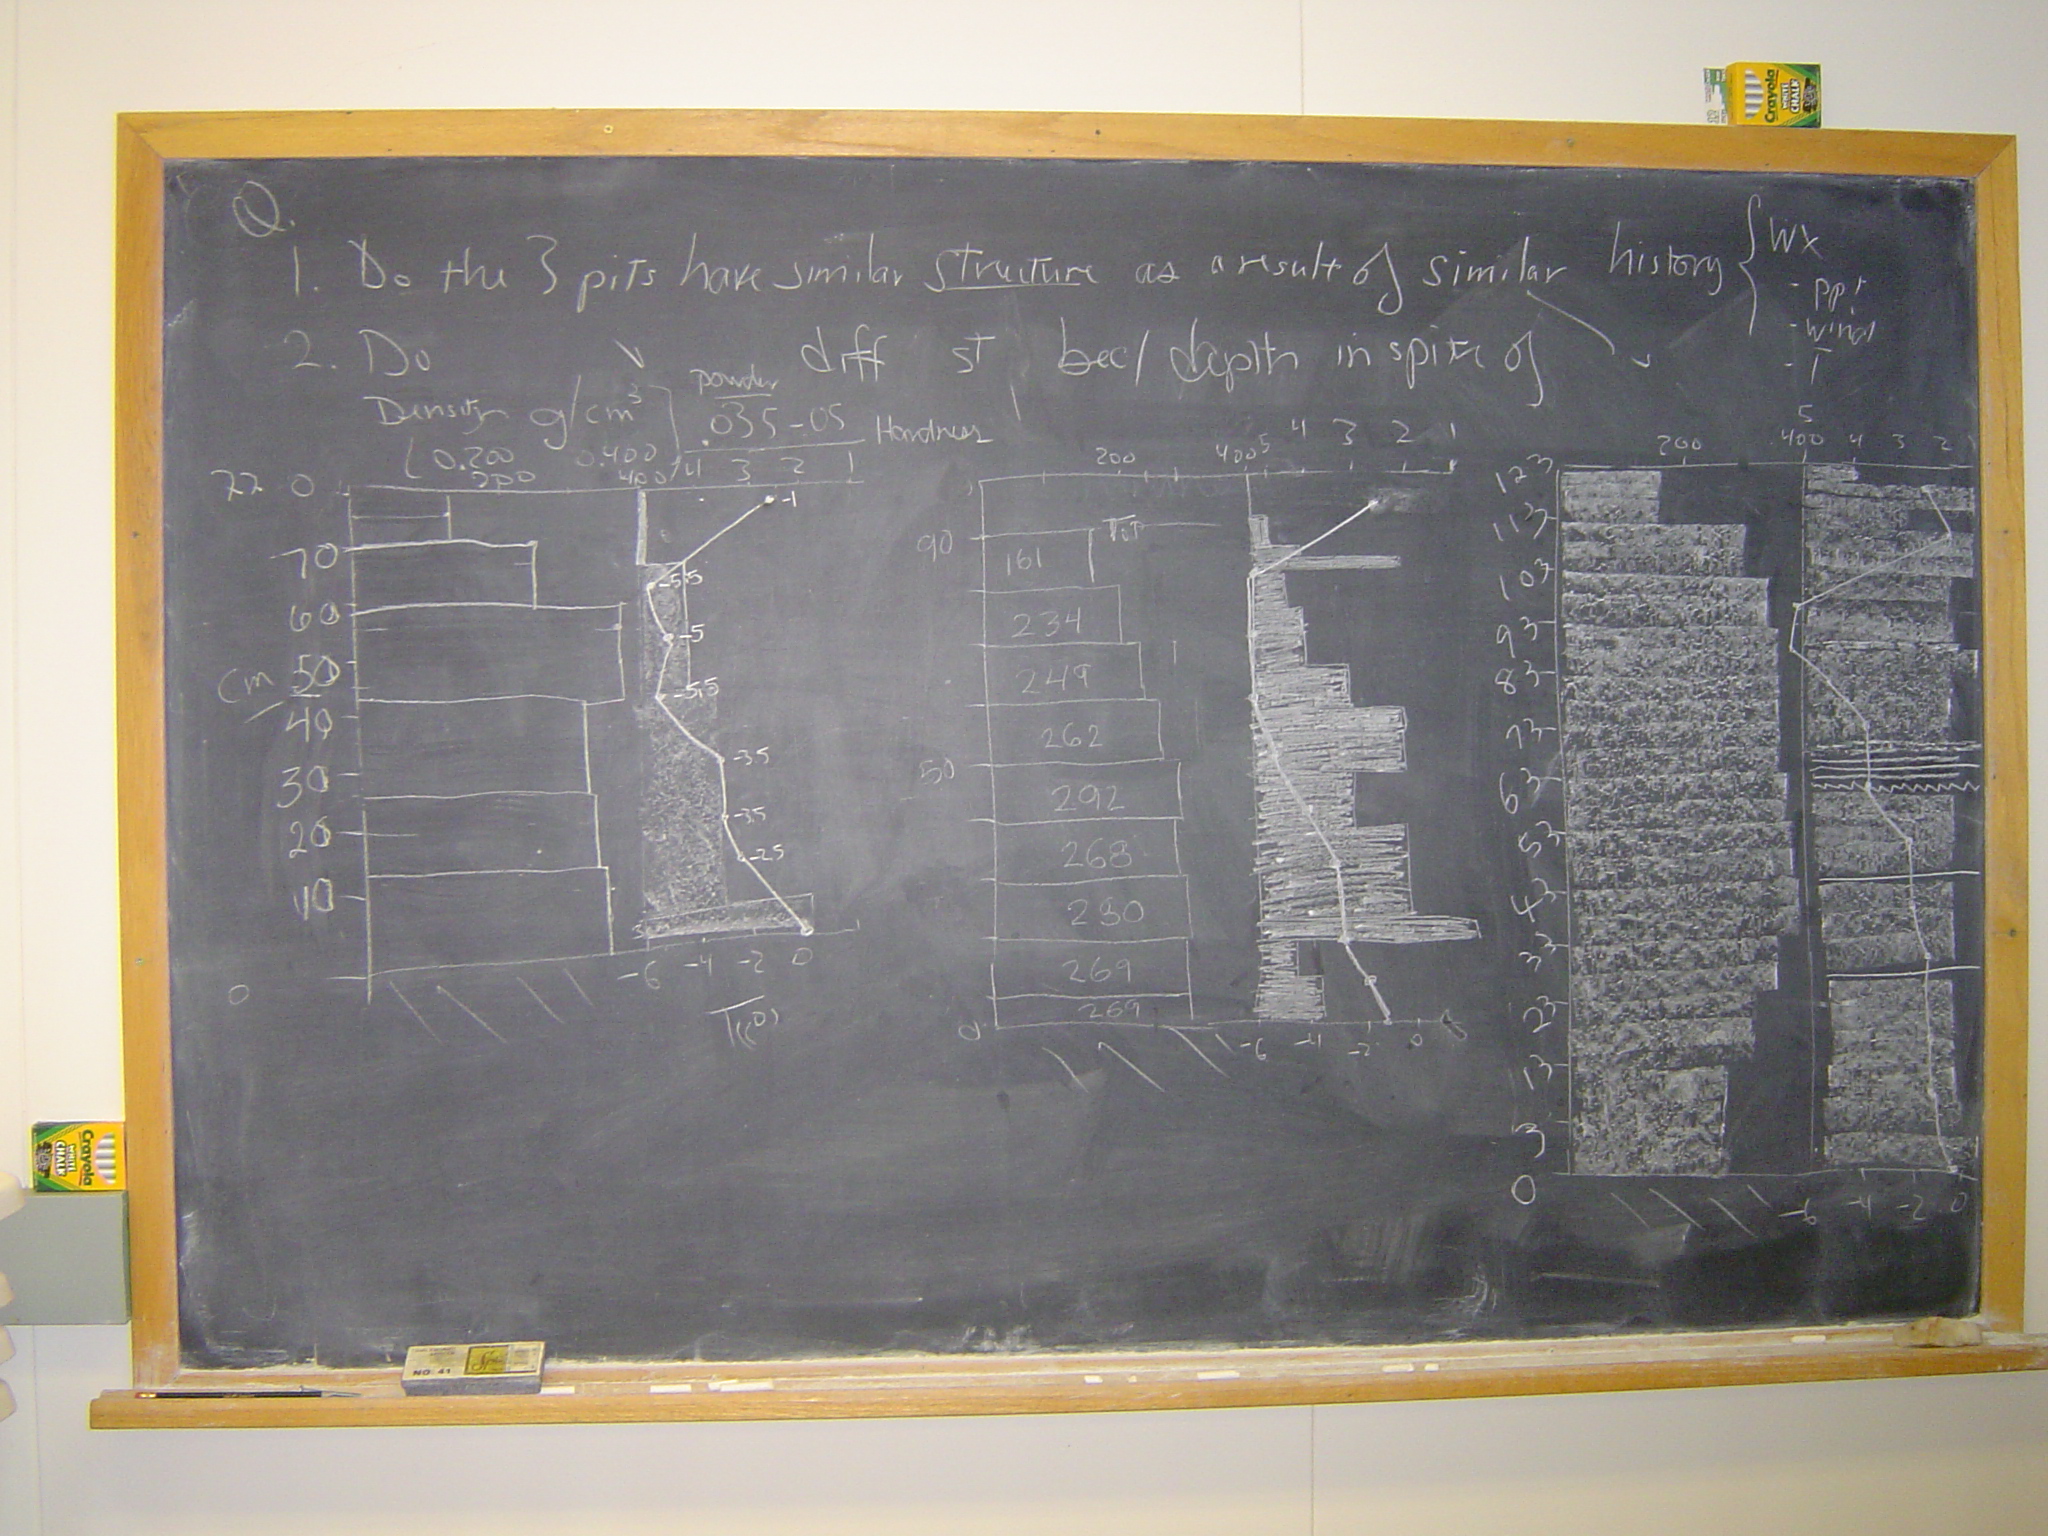
- Blackboard graphs (jpg, 200k)
- 2009-10 Winter weather record up through Snowpit day - C1 new snow and temperature record - from Kurt Chowanski
- Snowpack profile datasheets (pdf, 900k), blackboard graphs (jpg, 1.3M - c/o Jyh)
- Red dust layer
- Photos of the red dust layer, 15-16 Feb 06 event: CAIC site, MRS & Niwot Ridge photos
- effects of dust layer continue through season: 30 April 06 snowpack report
- Retrospective article: Intermountain West Climate Summary
| 2019 |
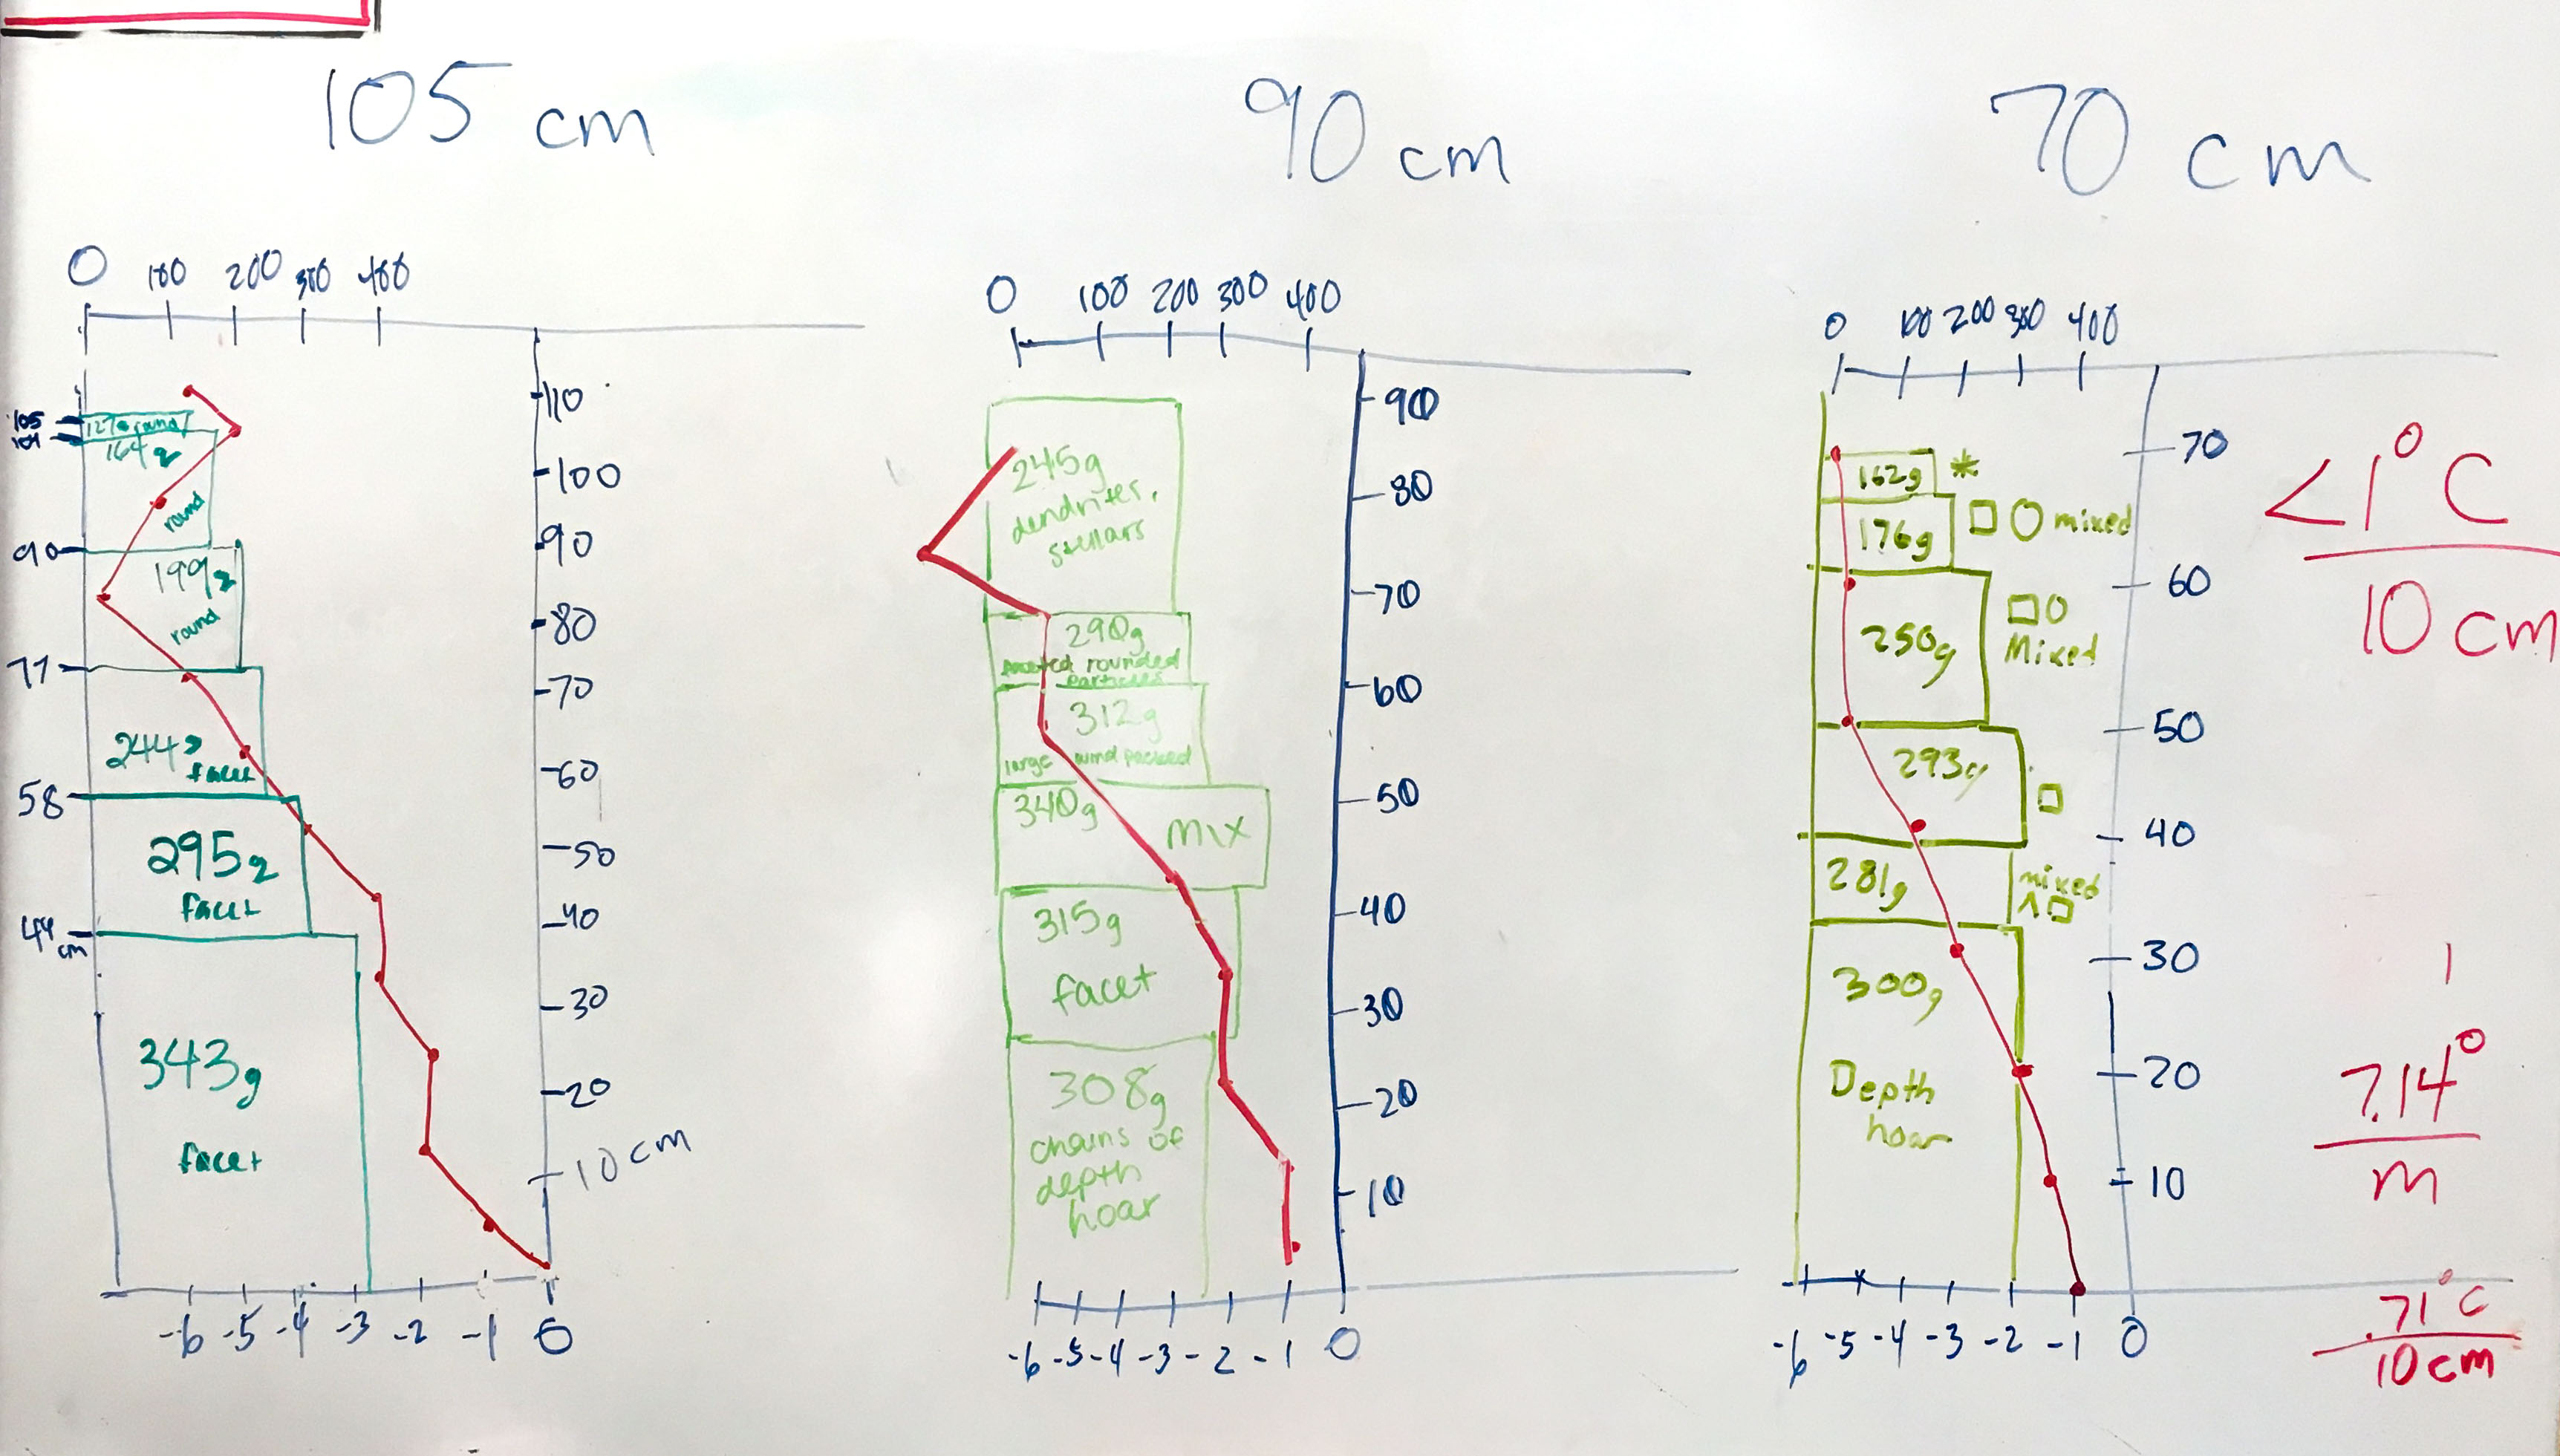
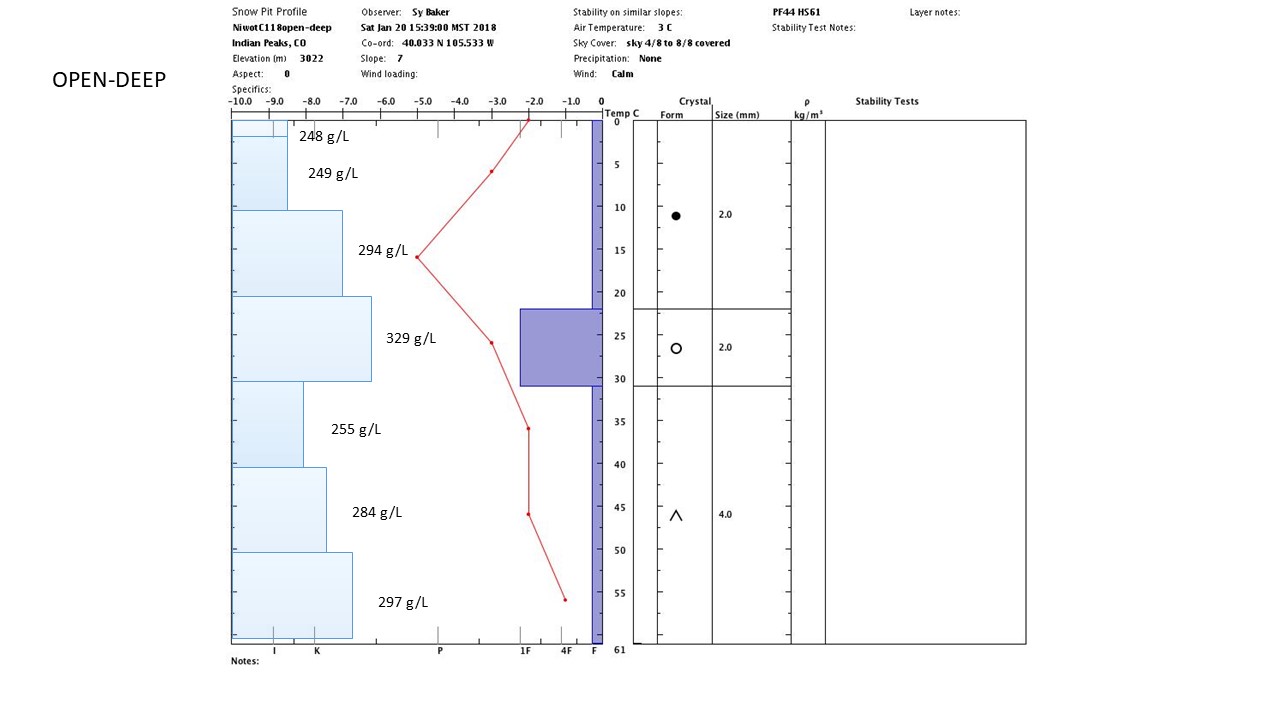
Snowpack Profile --
1/26/19 Discussion
 |
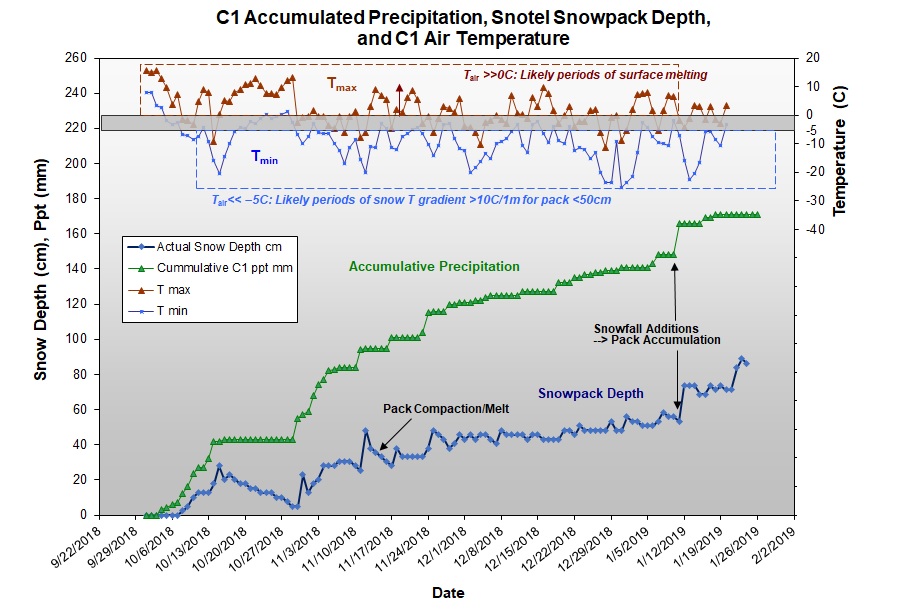
C1 Weather Record and Snotel Snowpack (click to enlarge)
 |
||||
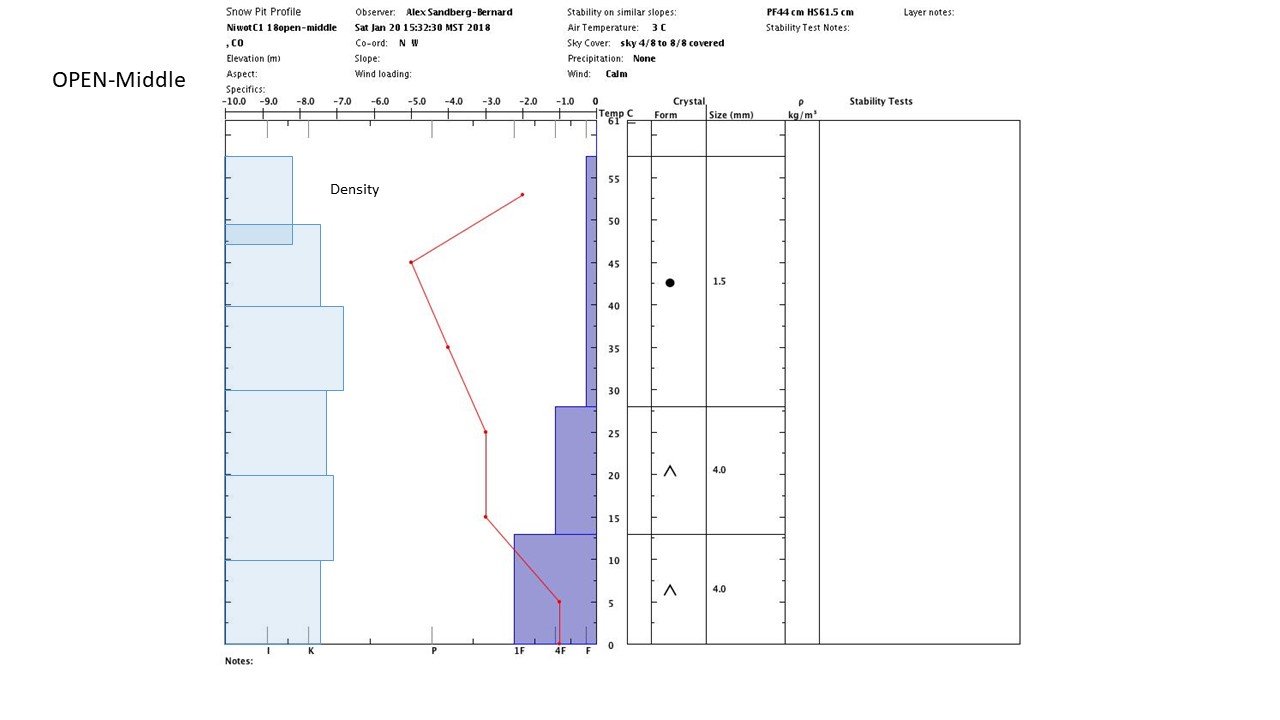
| 2018 |
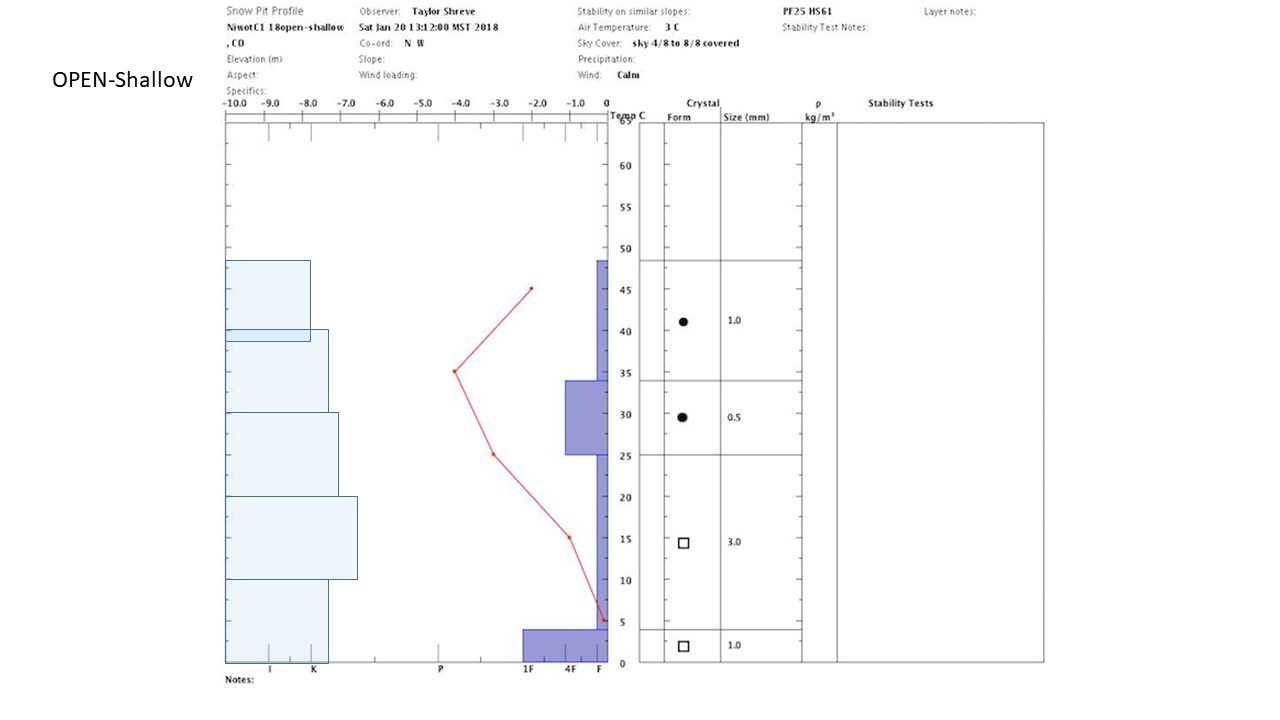
Snowpack Profile --
1/20/18 Discussion
Pit Profiles (click to
enlarge) --
|
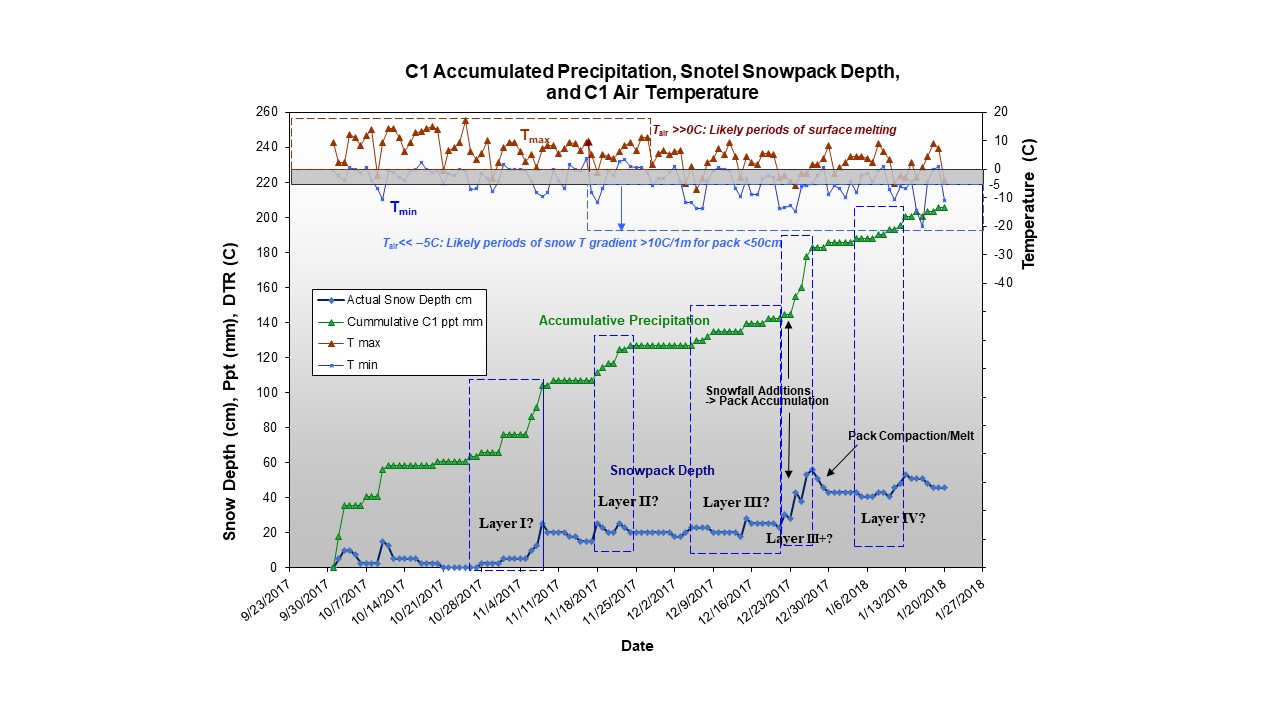
C1 Weather Record
and Snotel Snowpack
(click to enlarge)
 |
||||
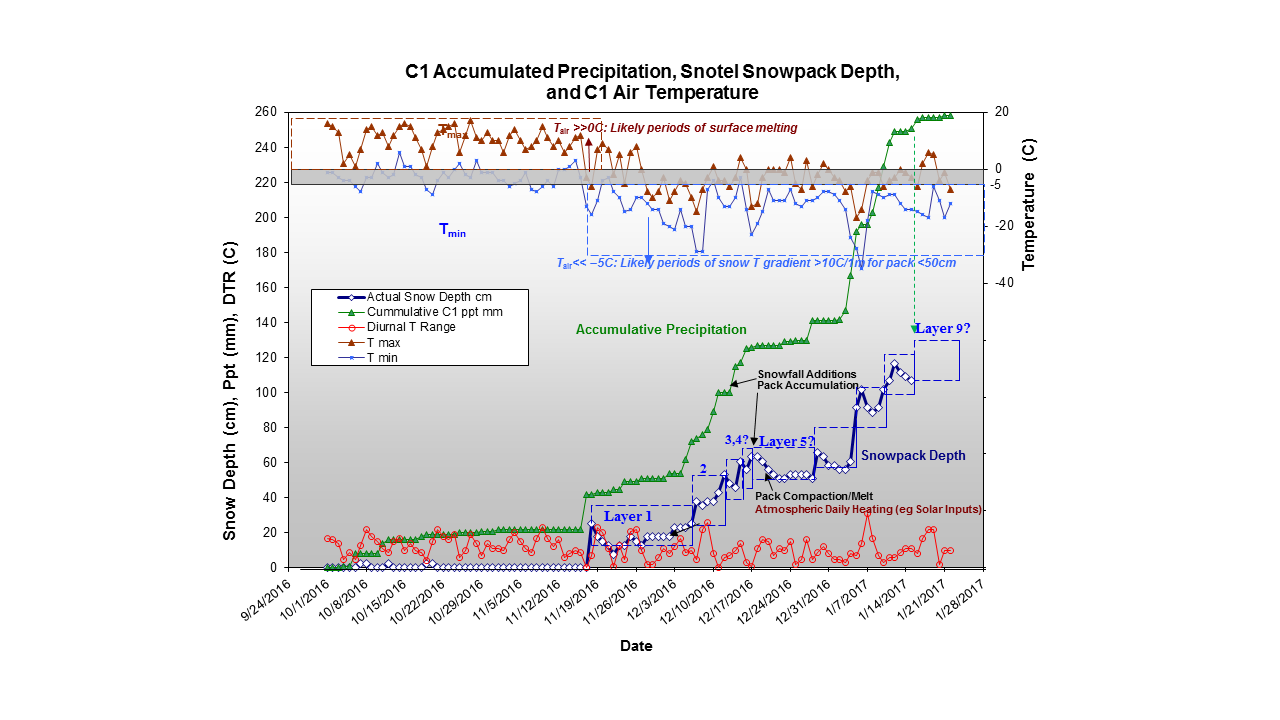
| 2017 |
Snowpack Profile --
1/22/17 Pit Profiles (click to enlarge)
|
C1 Weather Record and Snotel Snowpack (click to enlarge)
 |
||||
| 2016 |
Snowpack Profile --
1/23/16 2016 Pit Profiles-- for
individual plots see pdf
 |
C1 Weather Record and Snotel Snowpack (click to enlarge)
 Click here for a possible interpretation of graph with respect to layers for Open Medium & Deep pits Photos (click
to
enlarge):
(c) T.Kittel  Shallow pit 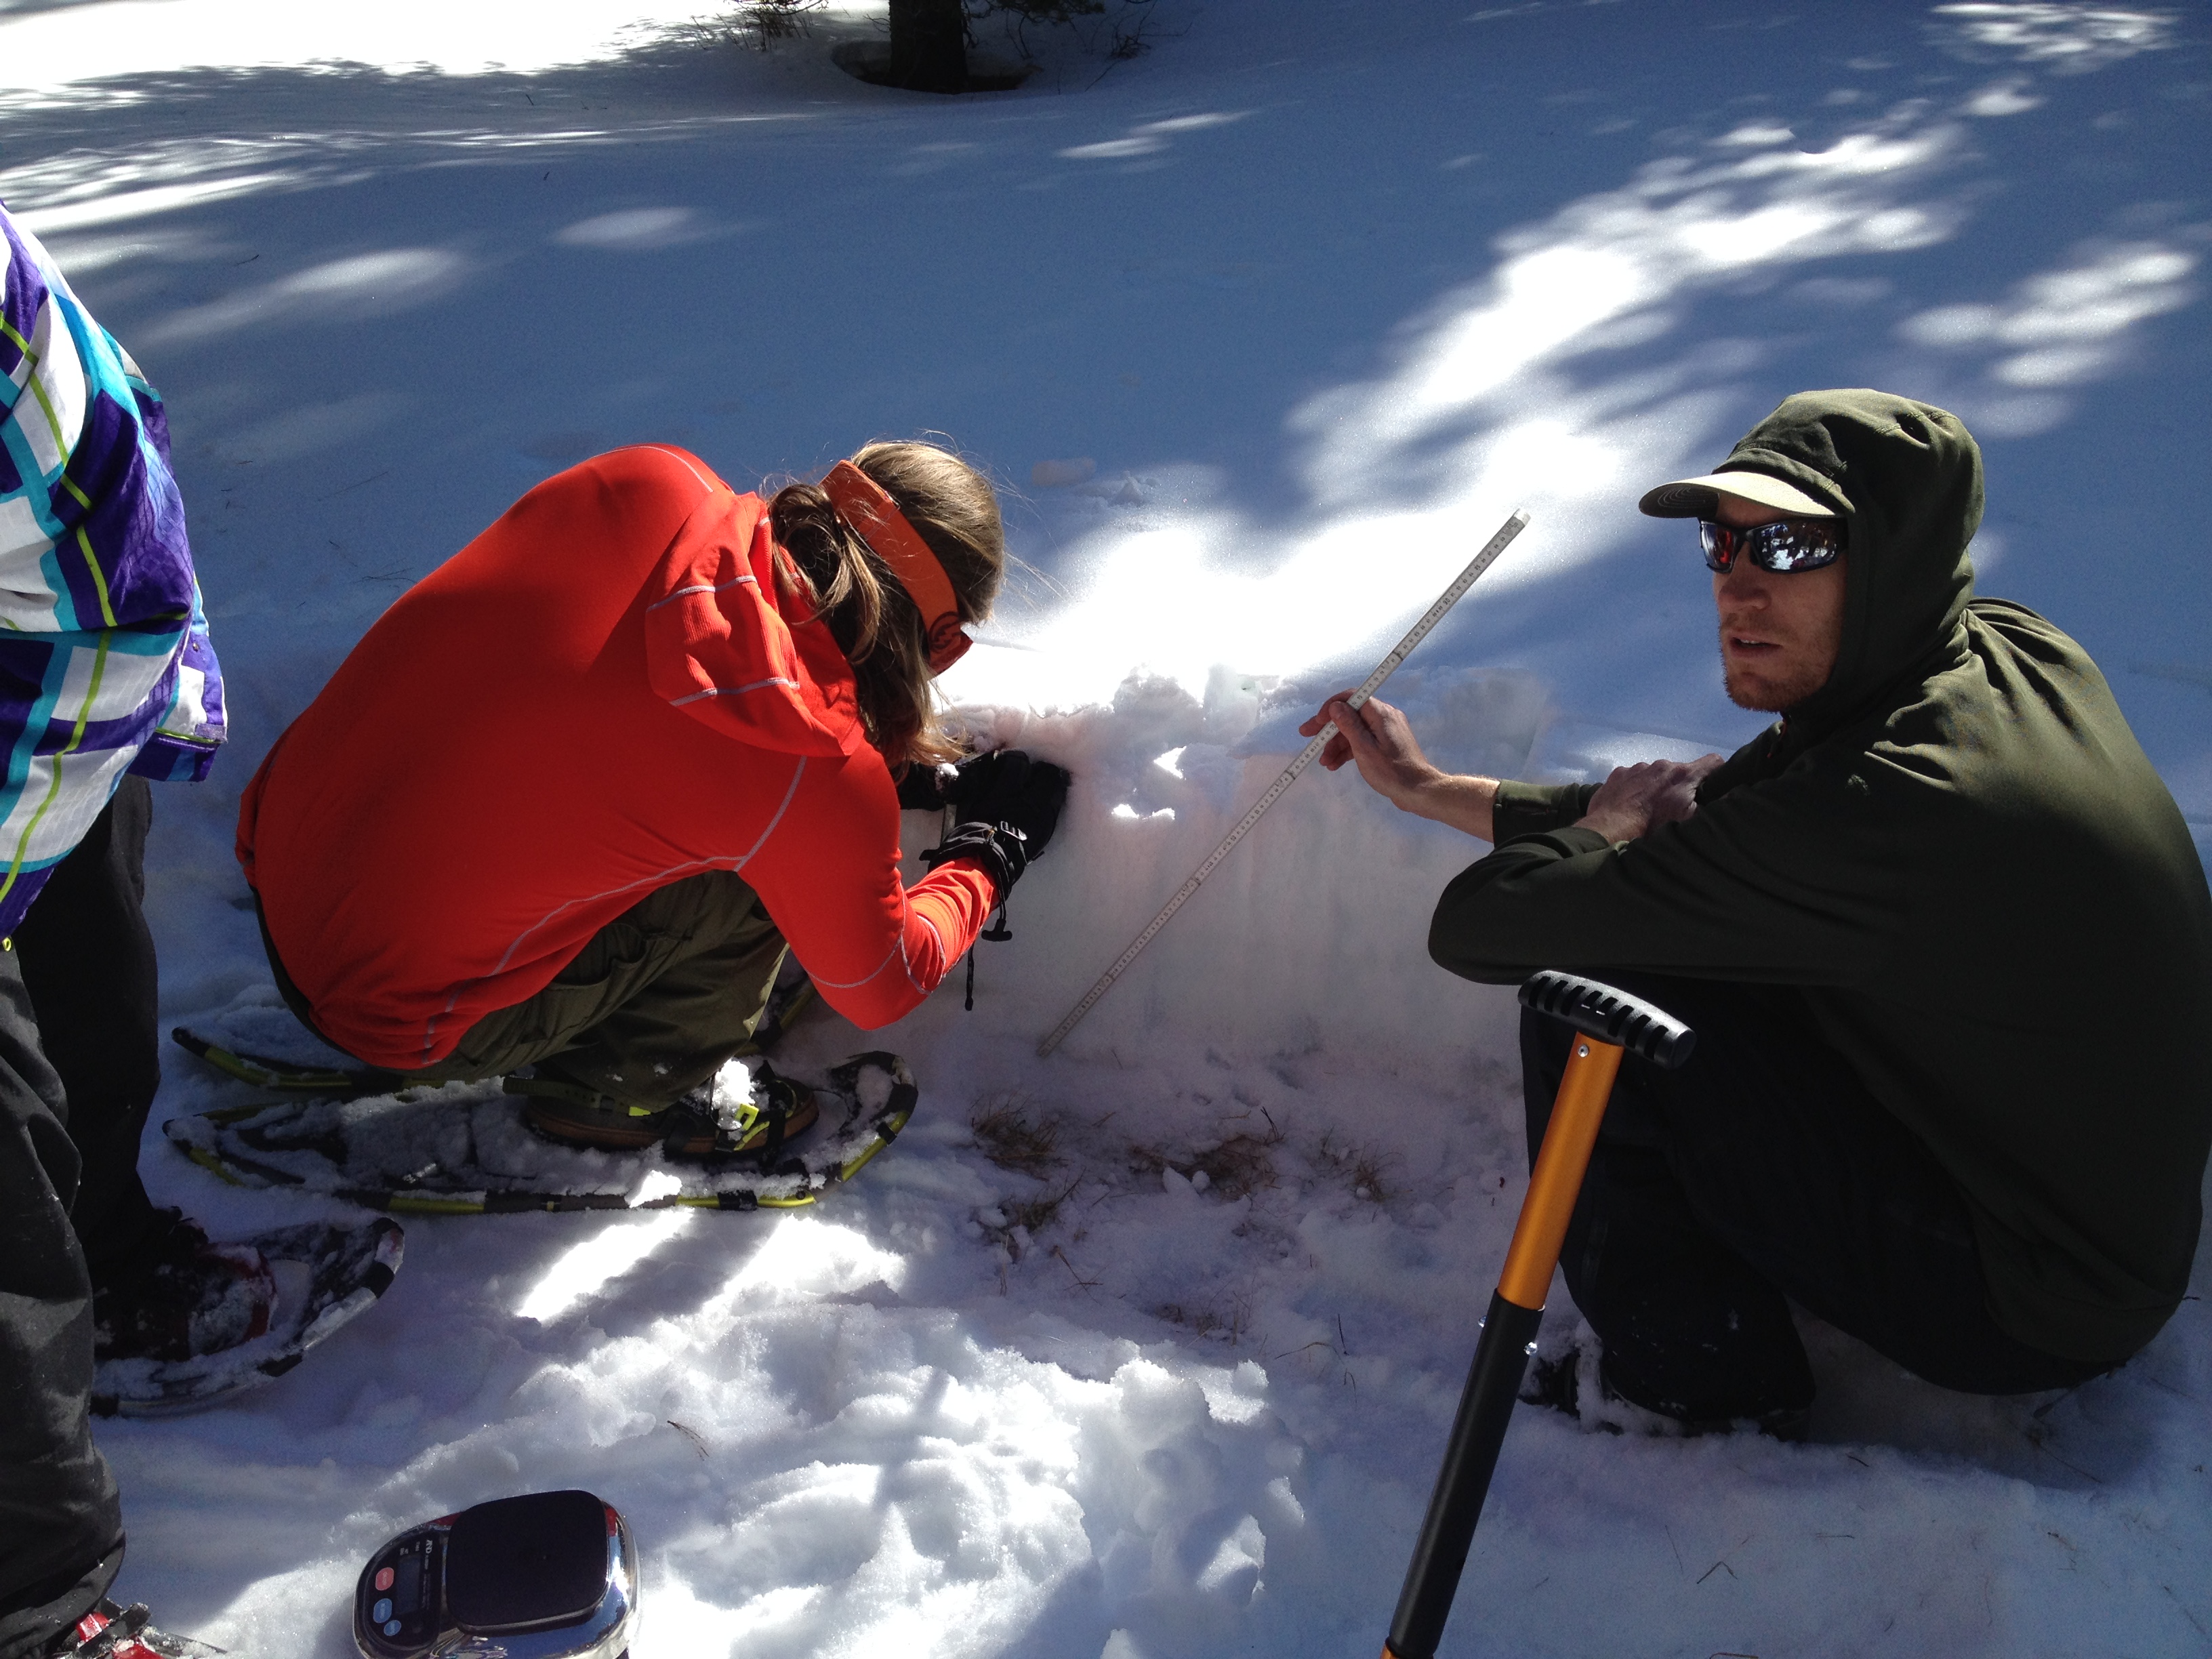 Medium depth pit
 Deep pit
|
||||
| 2015 |
Snowpack Profile --
1/24/15 2015 Pit
Profiles-- for individual
plots see pdf
 |
C1 Weather Record
and Snotel Snowpack -- (click to enlarge)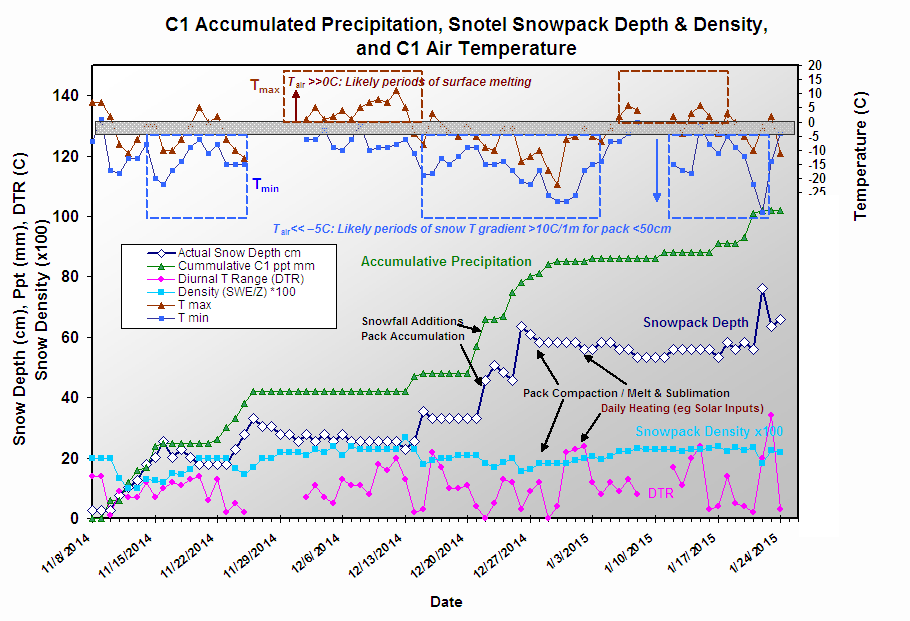 |
||||
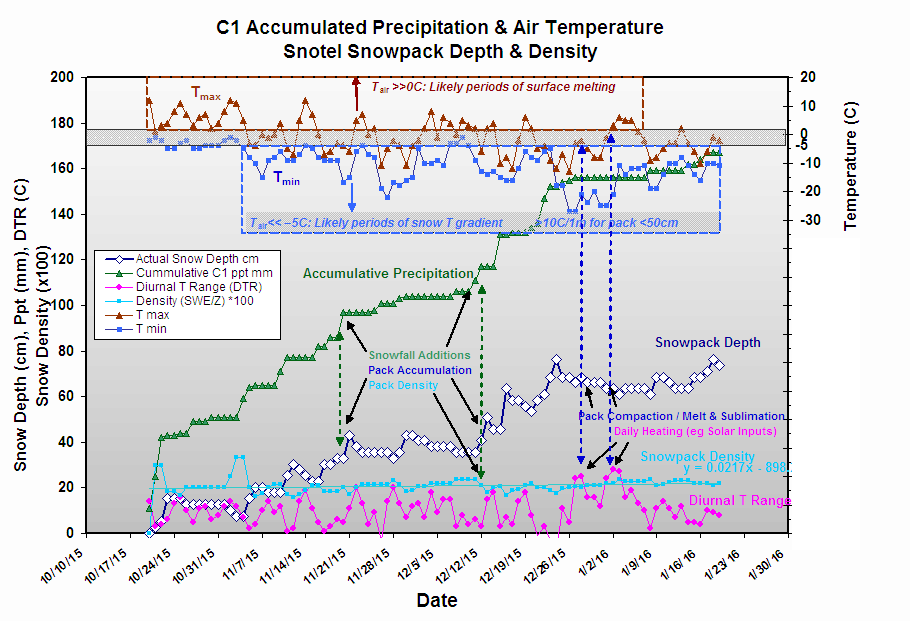
| 2014 |
Snowpack Profile -- 2014 Pit
Profiles-- for individual
plots see pdf
|
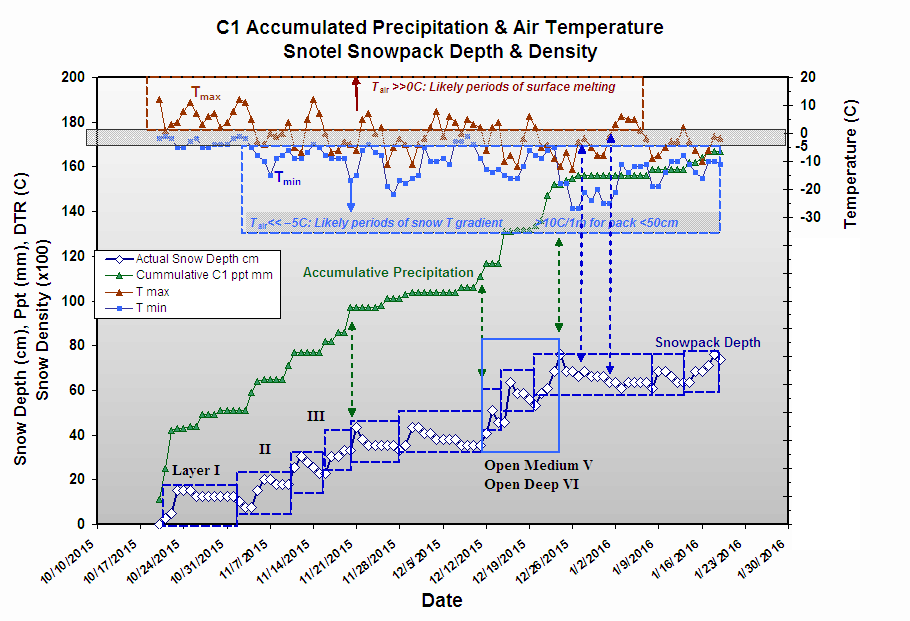
Weather Record and Snotel
Snowpack**--
 ** For an interpretation of 2014 Snowpack Pit Layers based on the above graph of Precipitation, SnoTel, and Temperature records: See pdf (70k) Photos (click
to
enlarge):
 Shallow open site
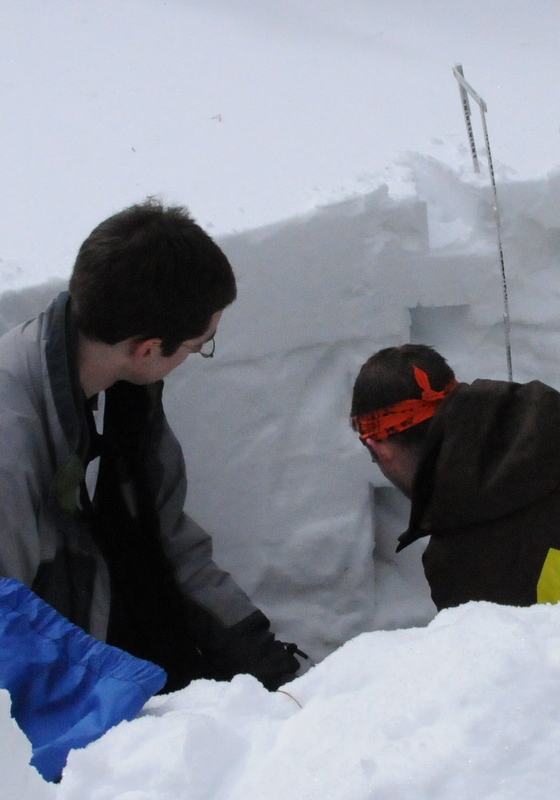
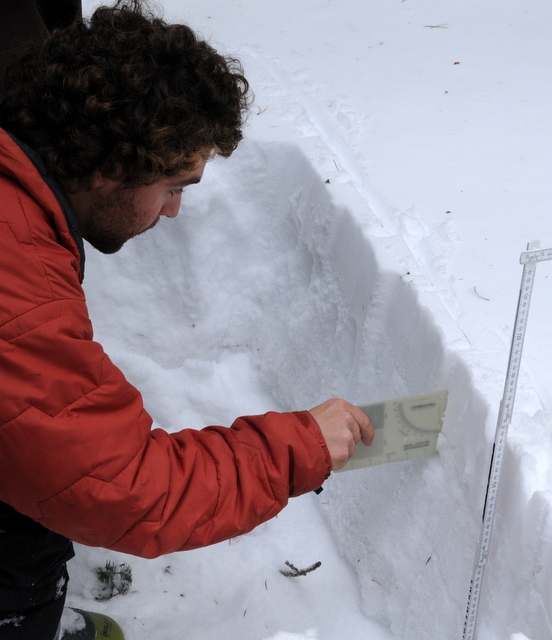
 Intermediate depth, open site - Hardness assessment  Deep, open site -
Density profile measurements
photos (c)T.Kittel
|
||||
| 2013 | 1/19/13
|
2013 Pit Profiles
-- (click
to
enlarge, also see results
pdf for annotated profile
graph)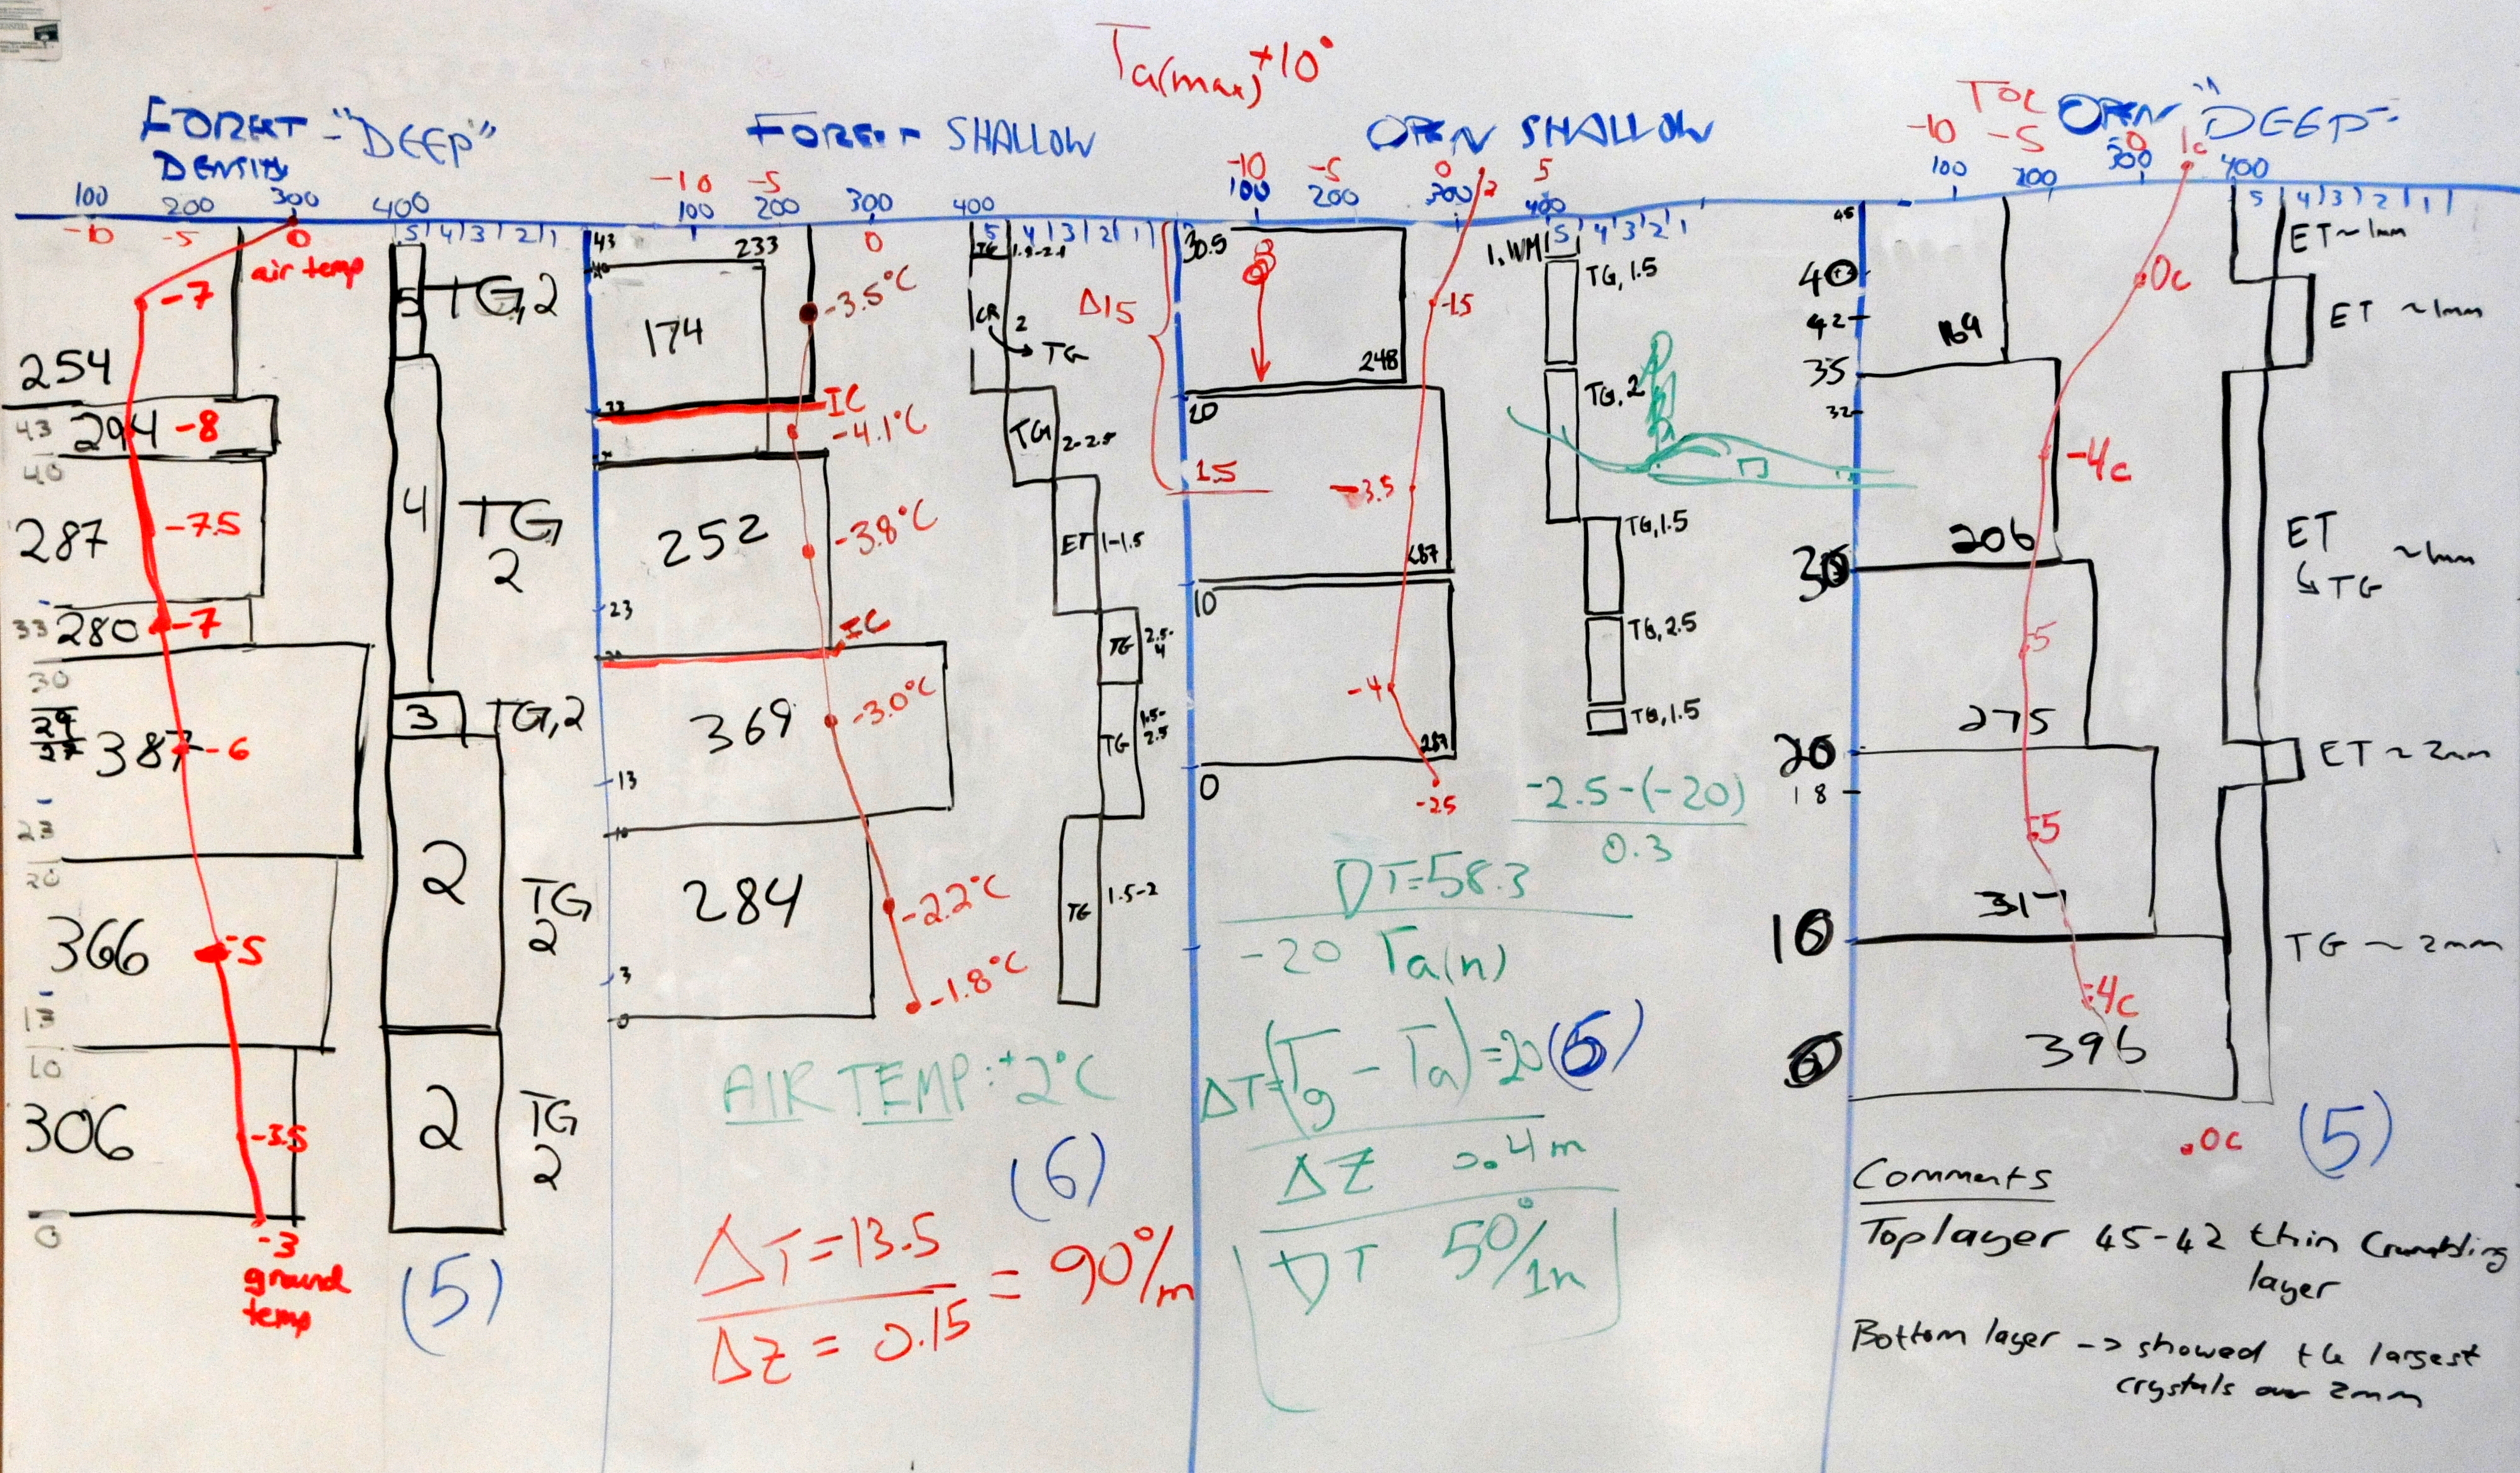 Weather Record and Snotel Snowpack -- 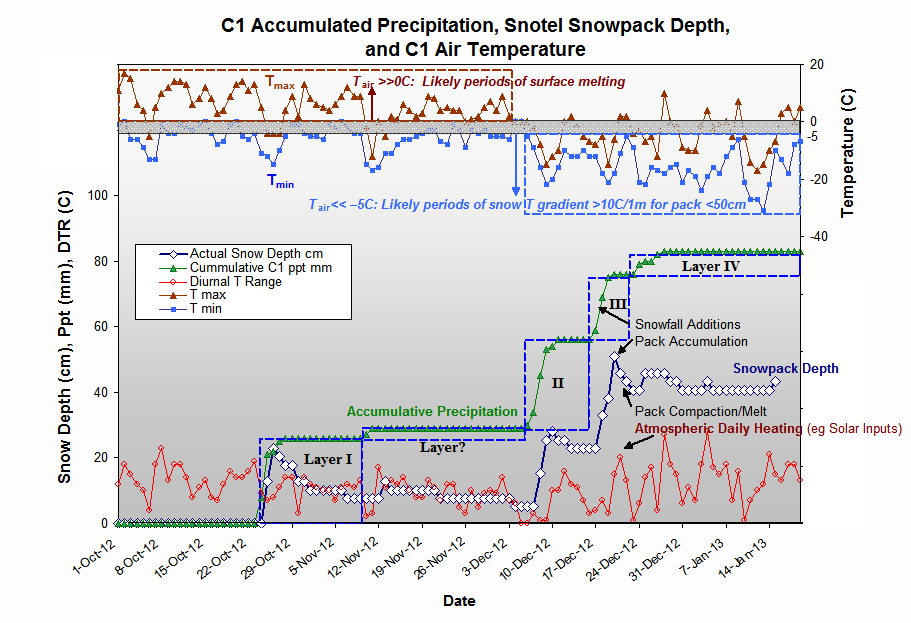 |
||||
| 2012 |
1/21/12 |
2012
Pit Profiles - See annotated
graph in results
pdf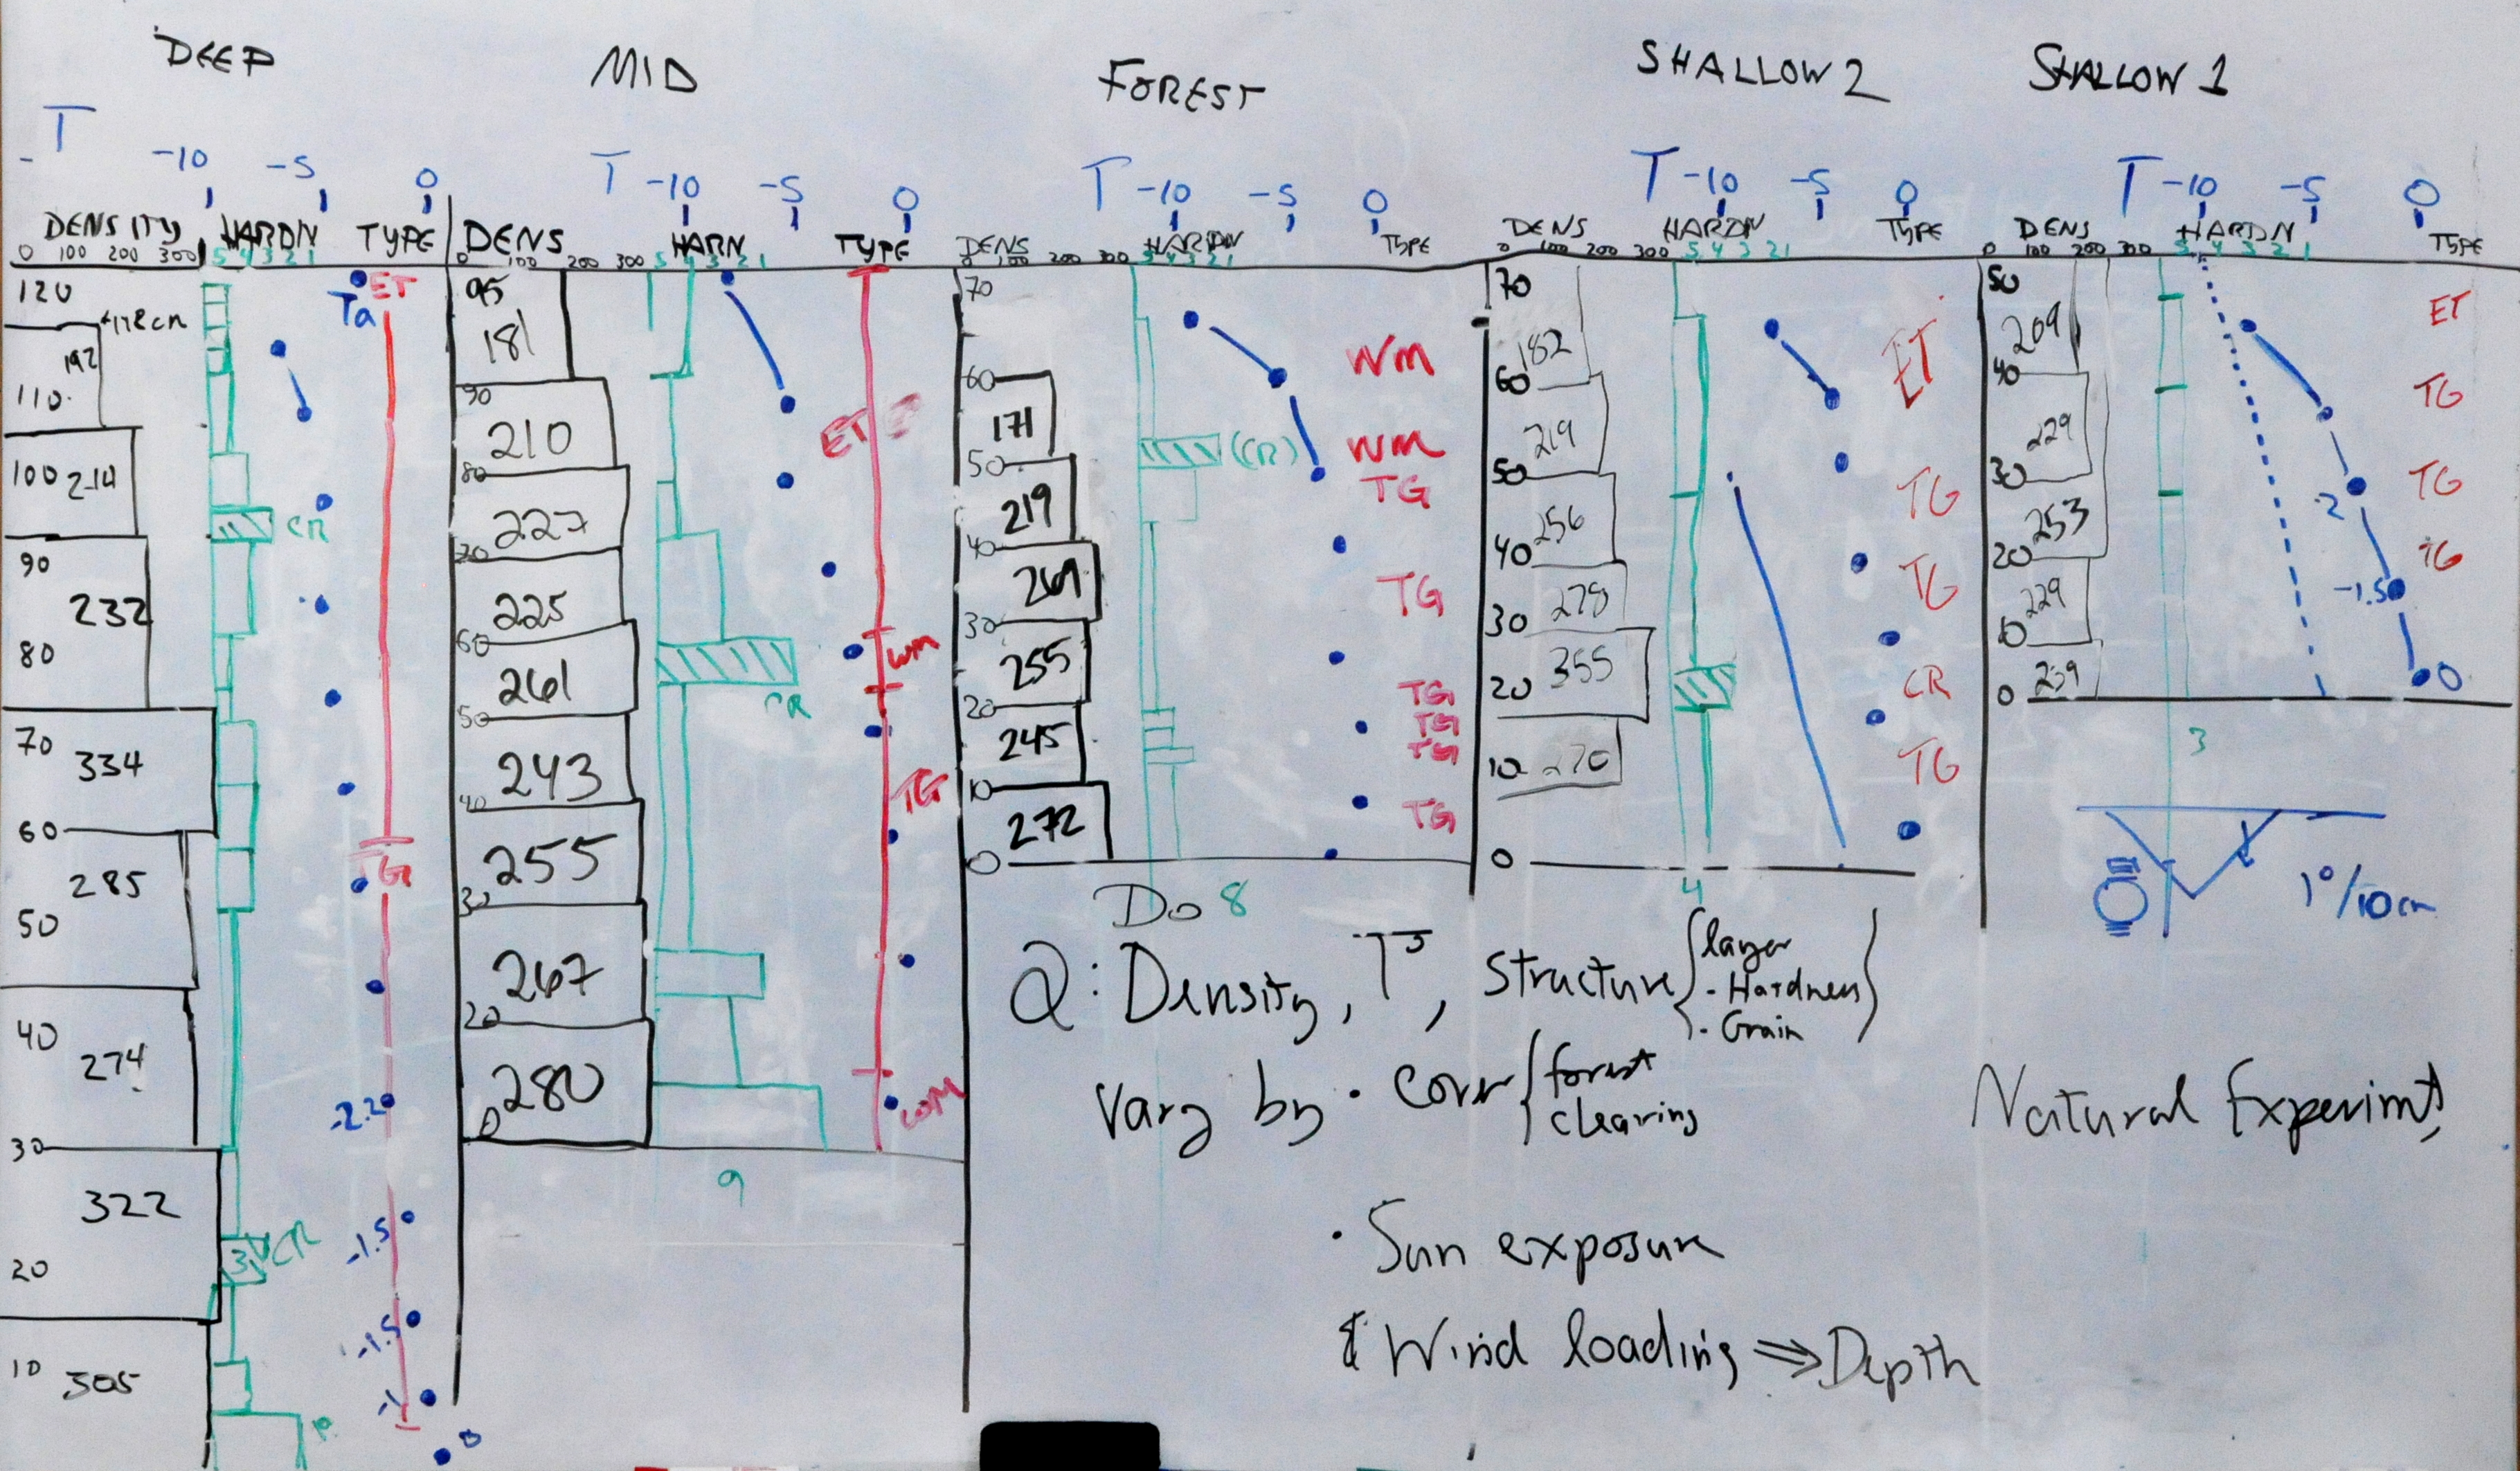 |
||||
| 2011 |
1/15/11
|
|||||
| 2010 | 1/23/10
|
click
image to enlarge  [photo TKittel] |
||||
| 2009 | 2/08/09 | |||||
| 2008 | 2/10/08 | |||||
| 2006 | 2/19/06
|
|||||
| 2005 | Spring '05 snowpack profile datasheets (pdf, 380k) |


