2019
|
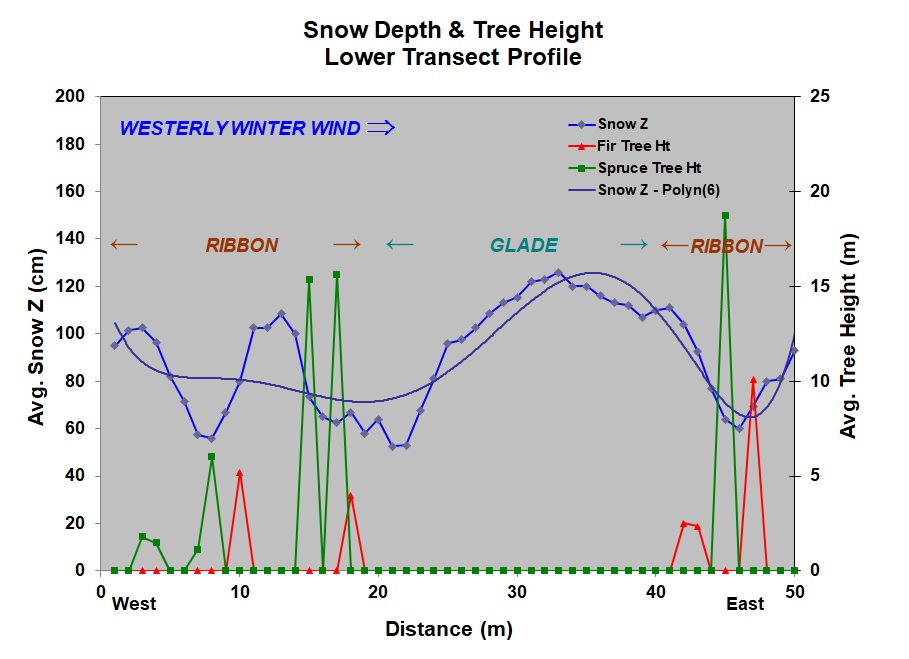
- Transect profiles:
- Transect Profile images below
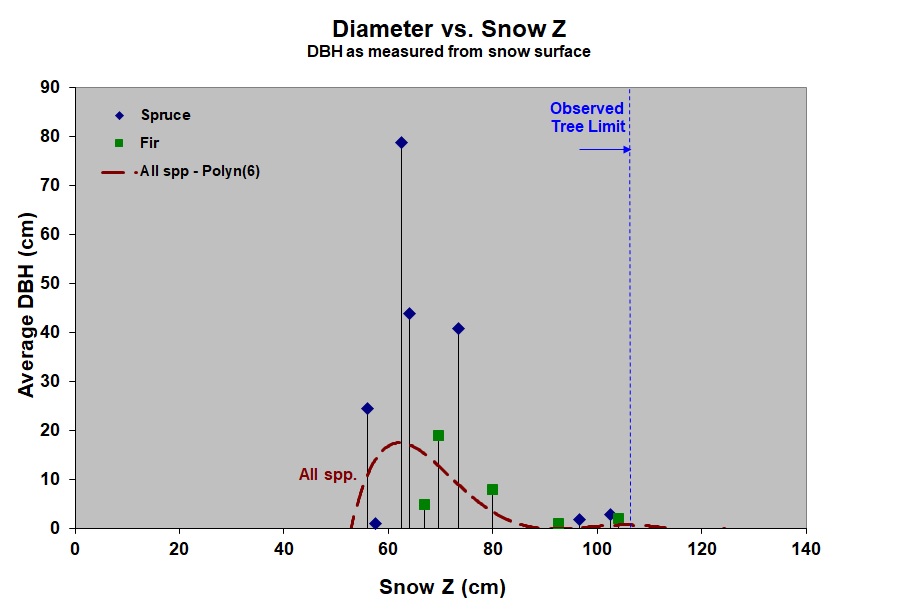
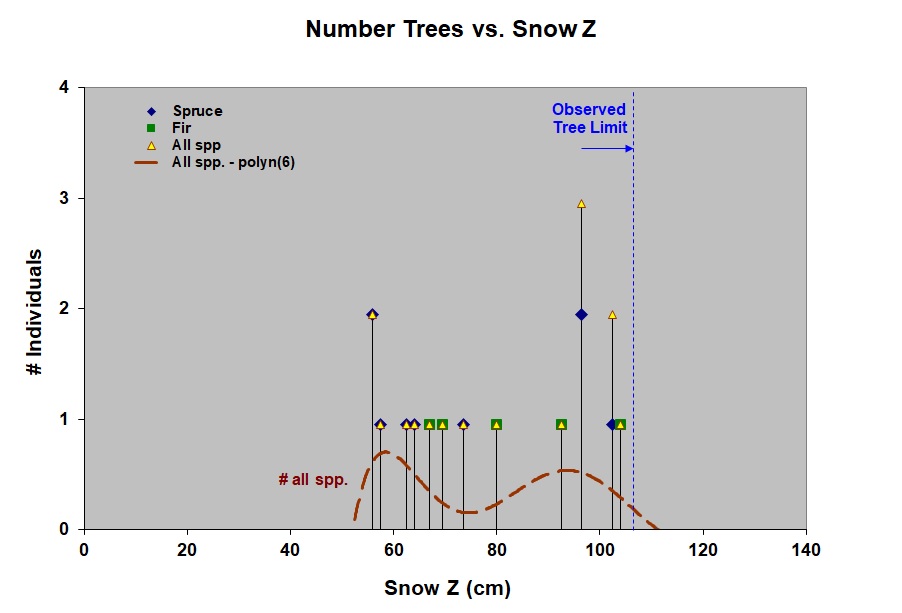
- Also below, plots of Tree Limit with respect
to Snow Depth in terms of Tree DBH, Height,
& Density (for Lower Transect)
- Discussion and Interpretation --
- How does the Ribbon Forest and Glade system
develop and propagate from West to East under
westerly winds in the lee of a geomorphic
ridge?
- You may wish to refer back to the Google
Earth image of the site
- While these are primarily abiotic factors
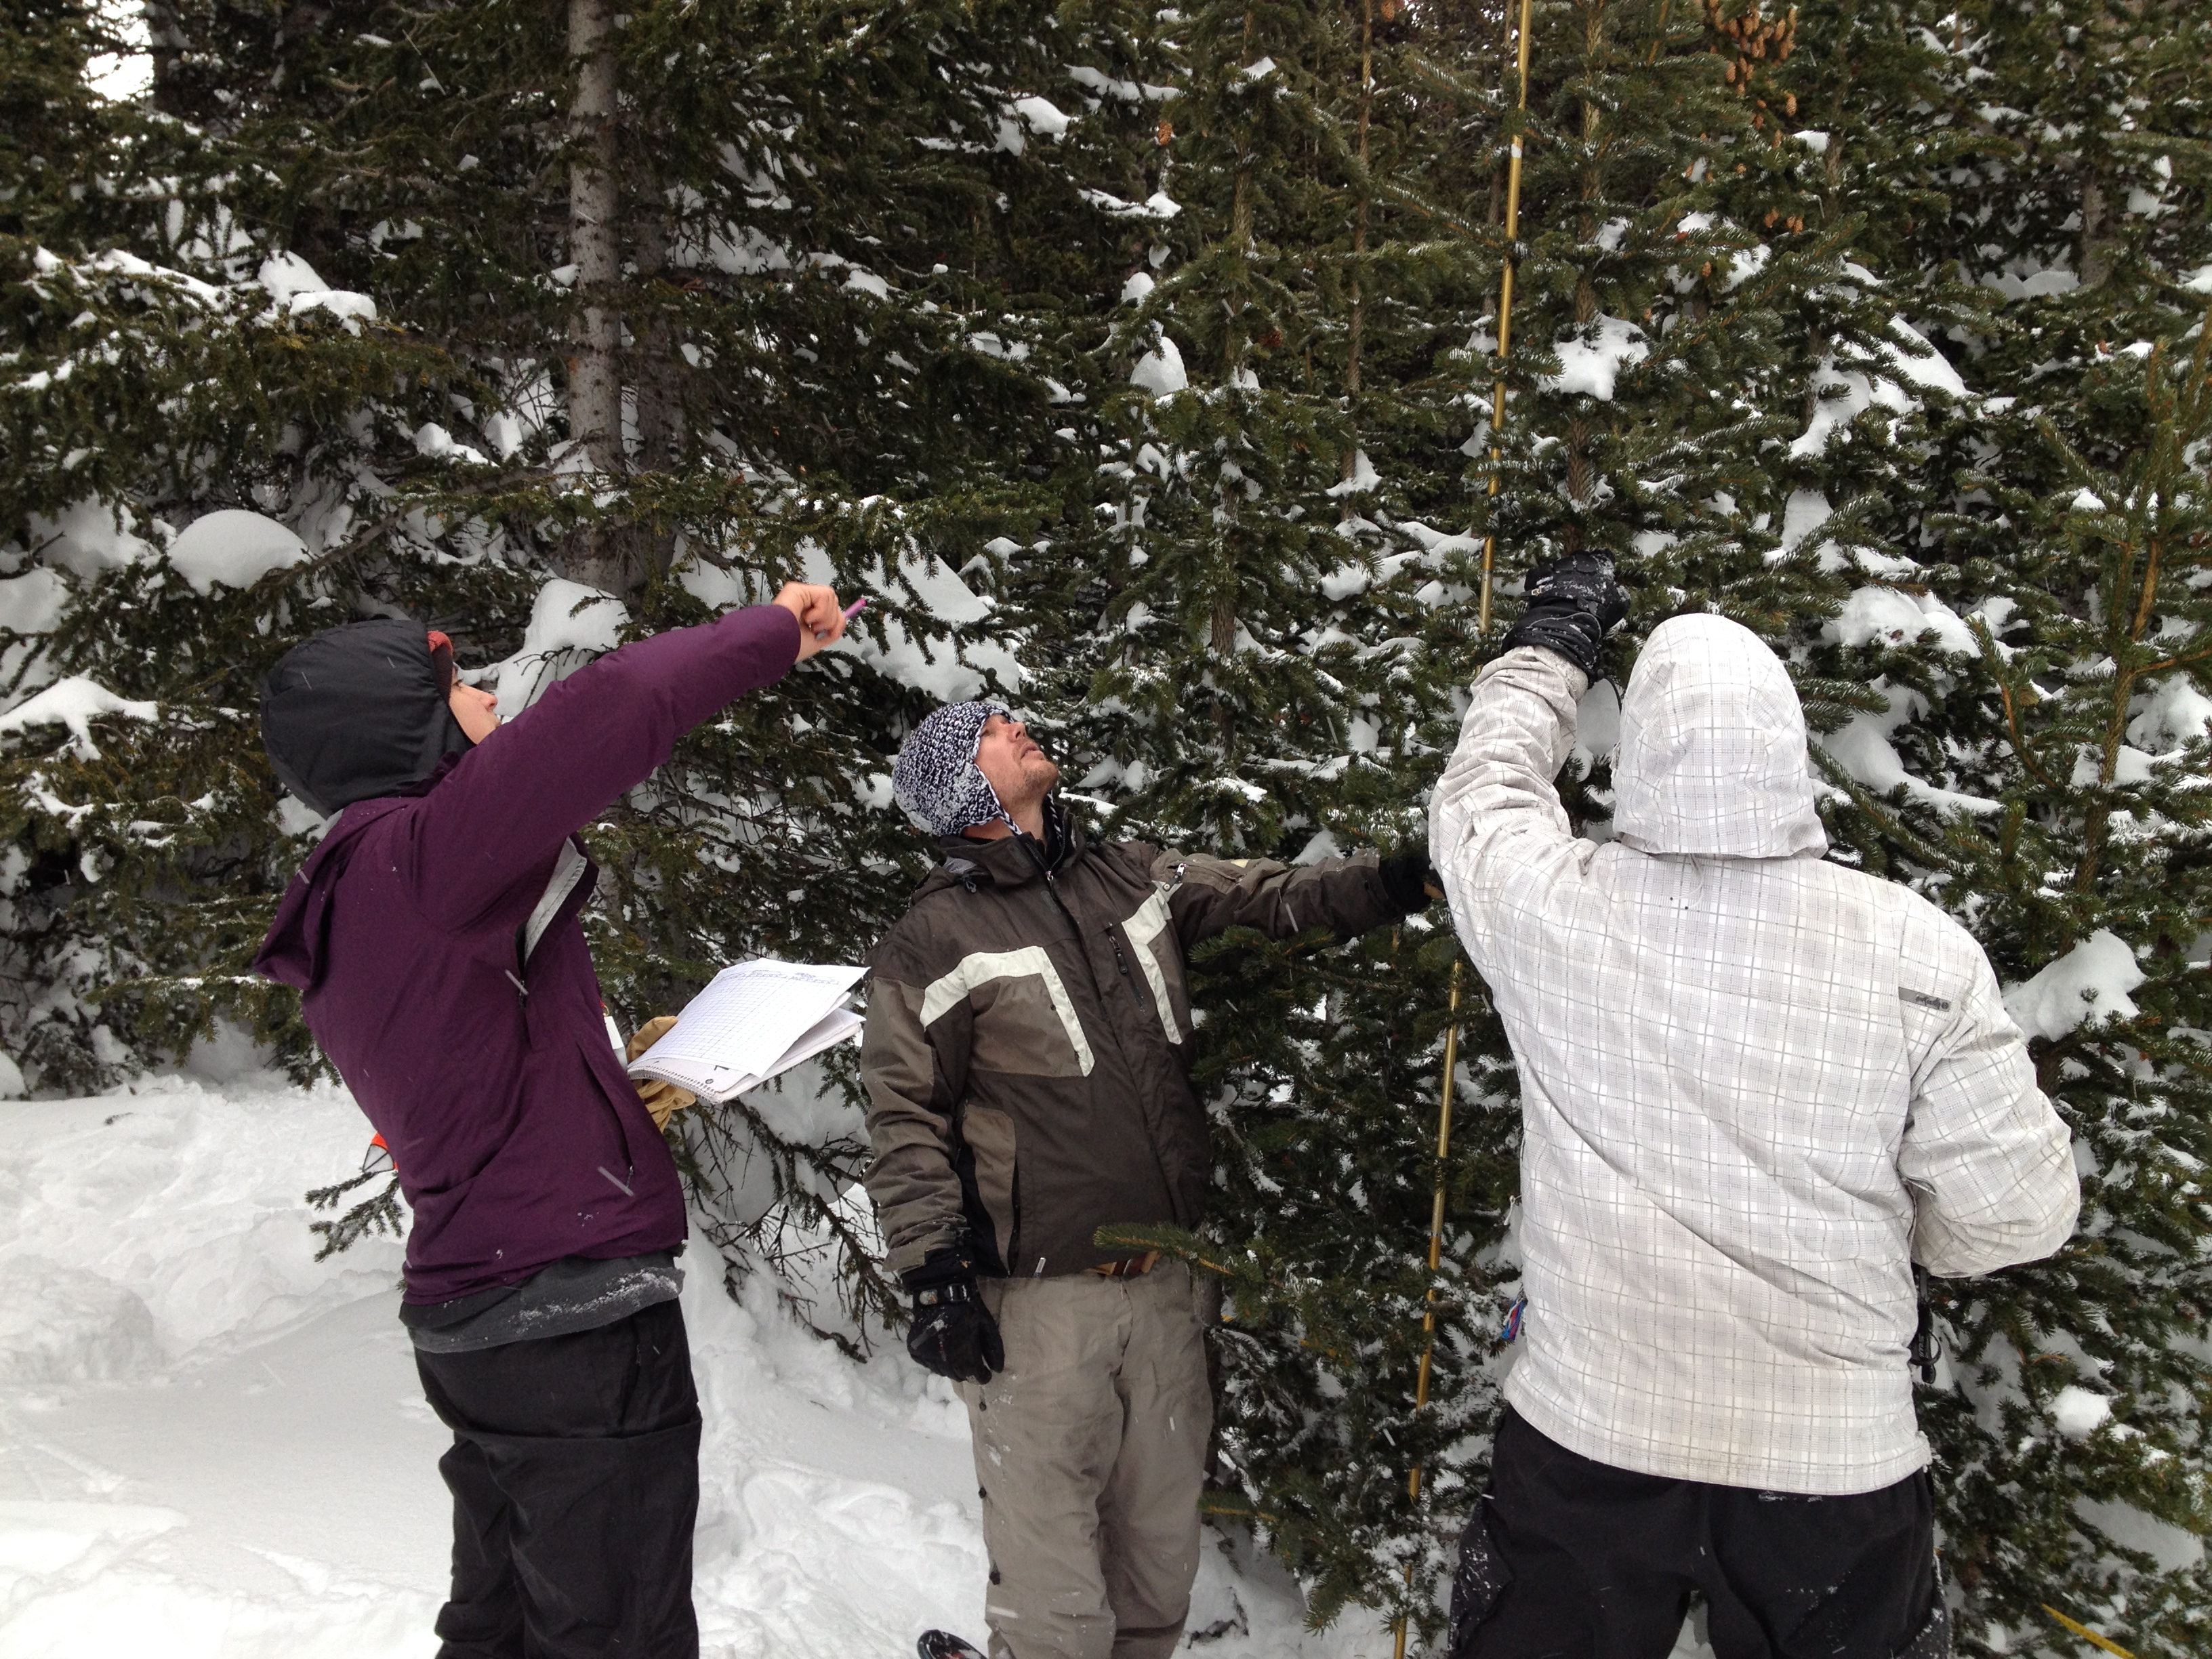
at work, what biotic factors also play a
role? -- hint: see photo to right
- What are the differences you observed in the age
structure between the Ribbon Forest and the
Subalpine Forest proper? -- see illustration in
the right panel.
- Explain which forest
(Ribbon vs. Subalpine
proper) is predominately structured by abiotic
processes vs. biotic ones? And
why these result in the observed age
structure?
- Is there a strong allometric relationship
between tree diameter and height for both
species? - see plot in the right panel,
lower down.
- What does allometric mean, and why are such
relationships useful?
- Do you think the relationship would hold for the
Subalpine Forest proper?
click images to enlarge
Lower Transect
|
Upper Transect
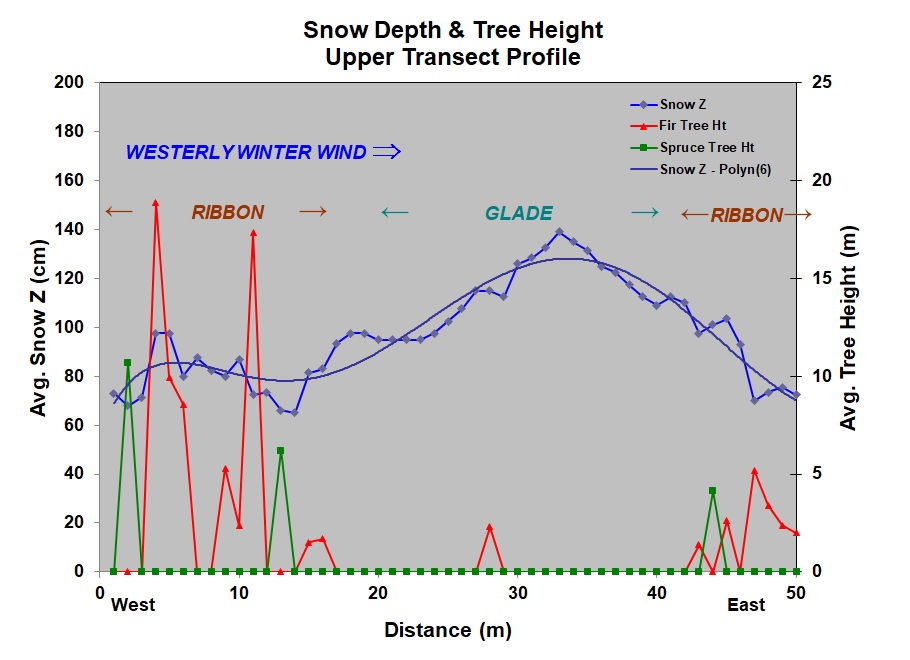
|
Tree Limit with respect to Snow Depth
- in terms of Tree DBH, Height, & Density
Lower Transect
click images to
enlarge
|
click images to enlarge
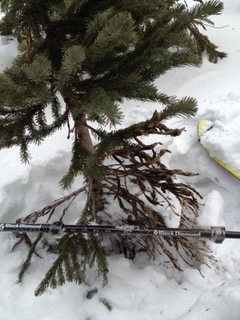
Snow mold damage on
Engelmann
Spruce sapling buried branches
[Photo (c) 2013 T Kittel]
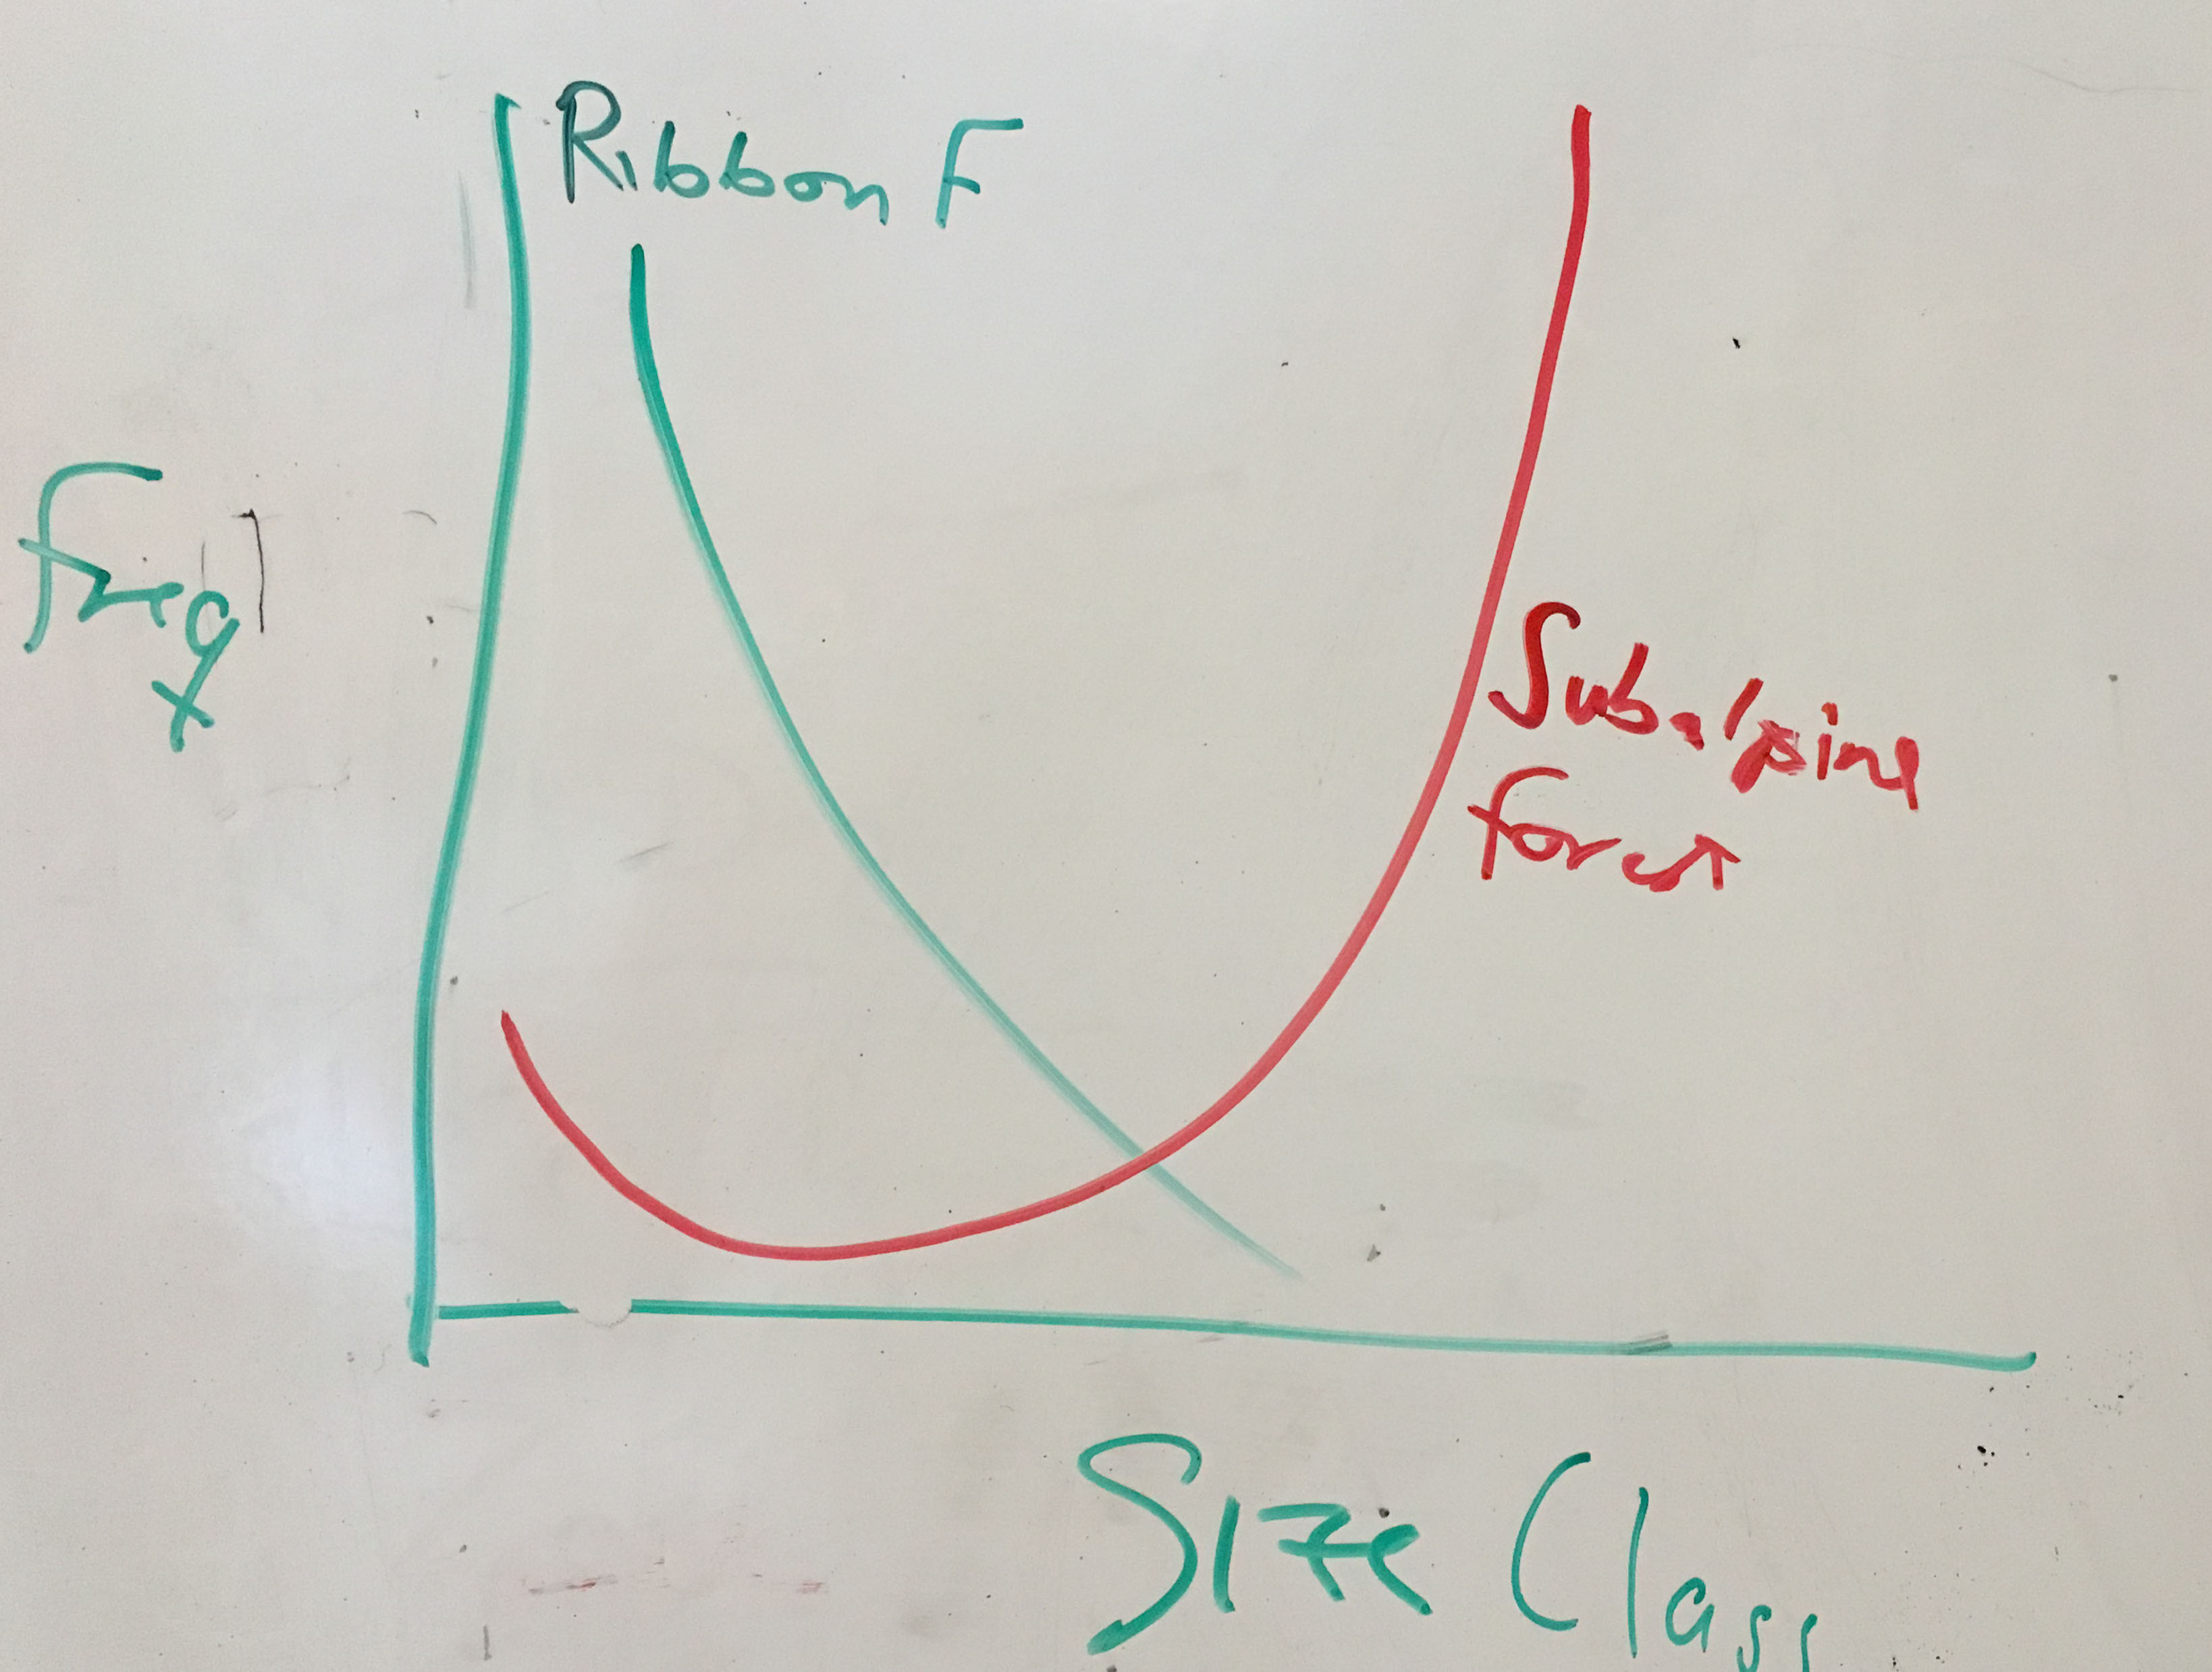
Age structure of the Ribbon
Forest (green) vs.
Subalpine Forest proper (red)
y-axis = frequency (=number of individuals in
each age class)
x-axis = age classes
Upper Transect - Allometry
 Relationship between DBH and Height, by species
Linear relationship strong?, similar for the 2
spp.?
Do you think the relationship would hold for the
Subalpine Forest proper?
|
|
Previous Years
|
|
2018
|
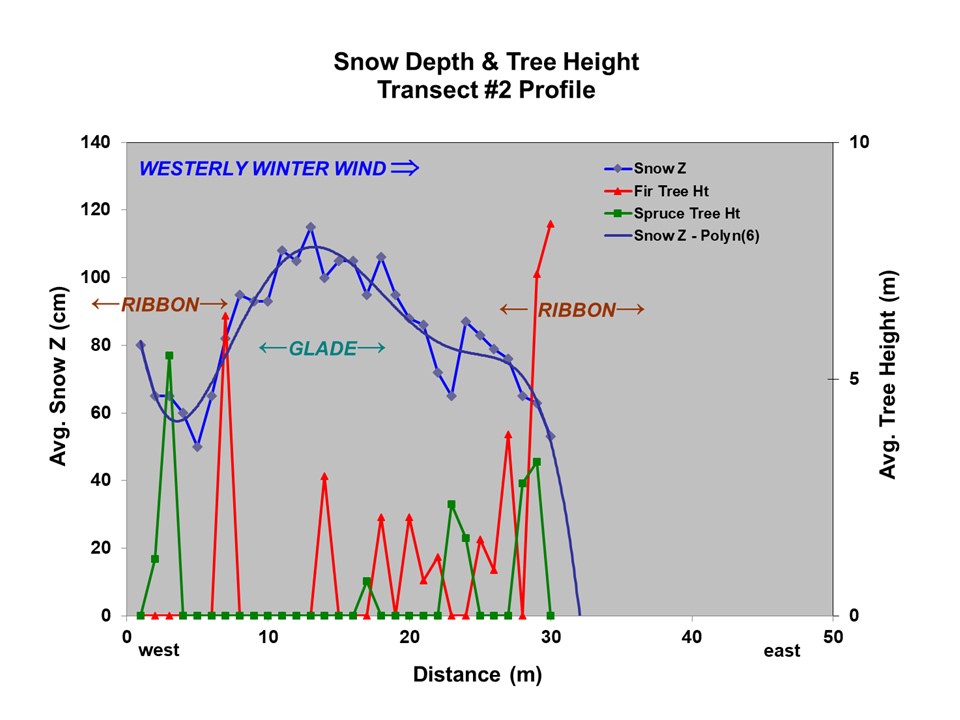
- Transect profiles:
- Transect Profile images below
- See Right panel for Tree Limit with
respect to Snow Depth in terms of Tree DBH,
Height, & Density (for Transect 2)
- Discussion and Interpretation - see
below
click images to
enlarge
Transect 1
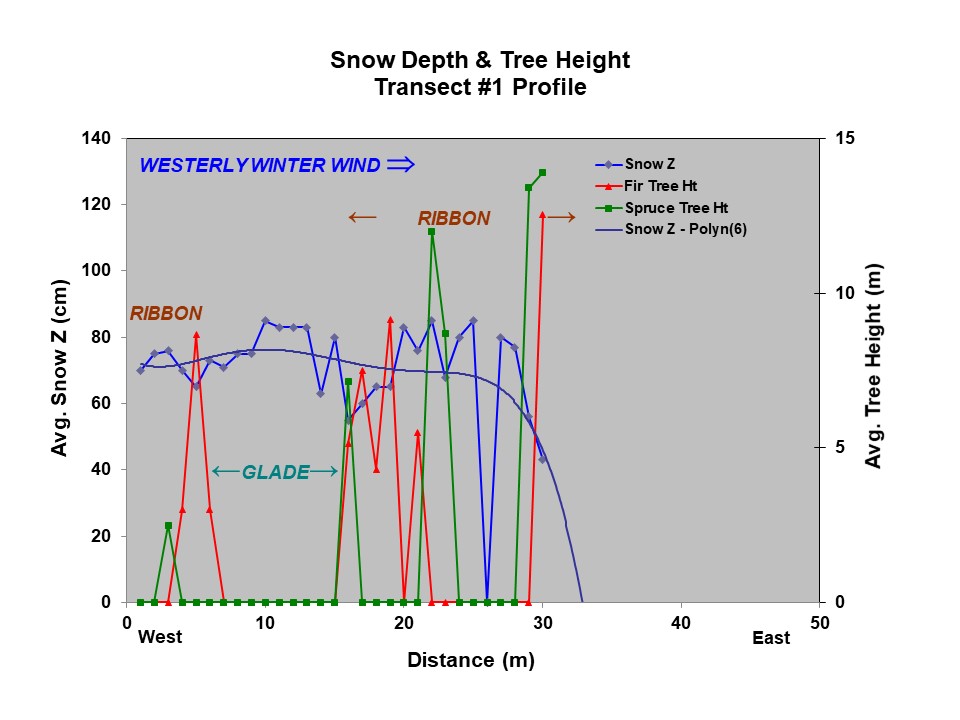
|
Transect 2
|
- Discussion and Interpretation -
- See Results from deep-snow years
(e.g., 2014,
2016)
for sharp relationships between snow depth and
forest properties (transect profile, tree
height & DBH)
- See
Discussion for 2013 (plots &
notes)
- Whiteboard images:

Development of Ribbon Forest and Glades (from
left to right)
- in the lee of a geomorphic ridge (in Brown with hash lines,
leftside of figure)
- under westerly winds (from Left
to Right)
Blue -
snowbank, Green -
moisture from snowmelt
Brown = growing
season based on duration of snowpack (for 1st
snowbank)
Purple = area of
optimal tree establishment and growth
|

Age structure of the Ribbon Forest vs.
Subalpine Forest proper
y-axis = frequency (=number of
individuals in each age class)
x-axis = age classes
|
|
click images to enlarge

Tree Limit (shown by Tree Diameter)
vs Snow Depth - Transect 2

Tree Limit (shown by Tree Height) vs Snow Depth
(SnowZ) - Transect 2
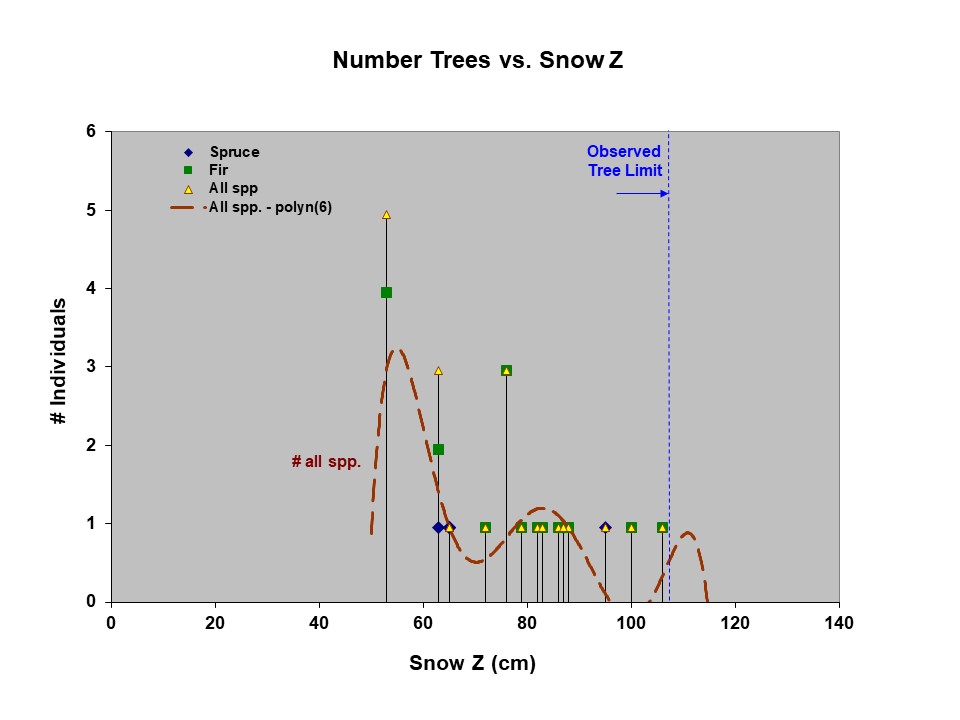
Tree Limit (shown by Tree Density) vs Snow Depth
(SnowZ) - Transect 2
|
2017
|
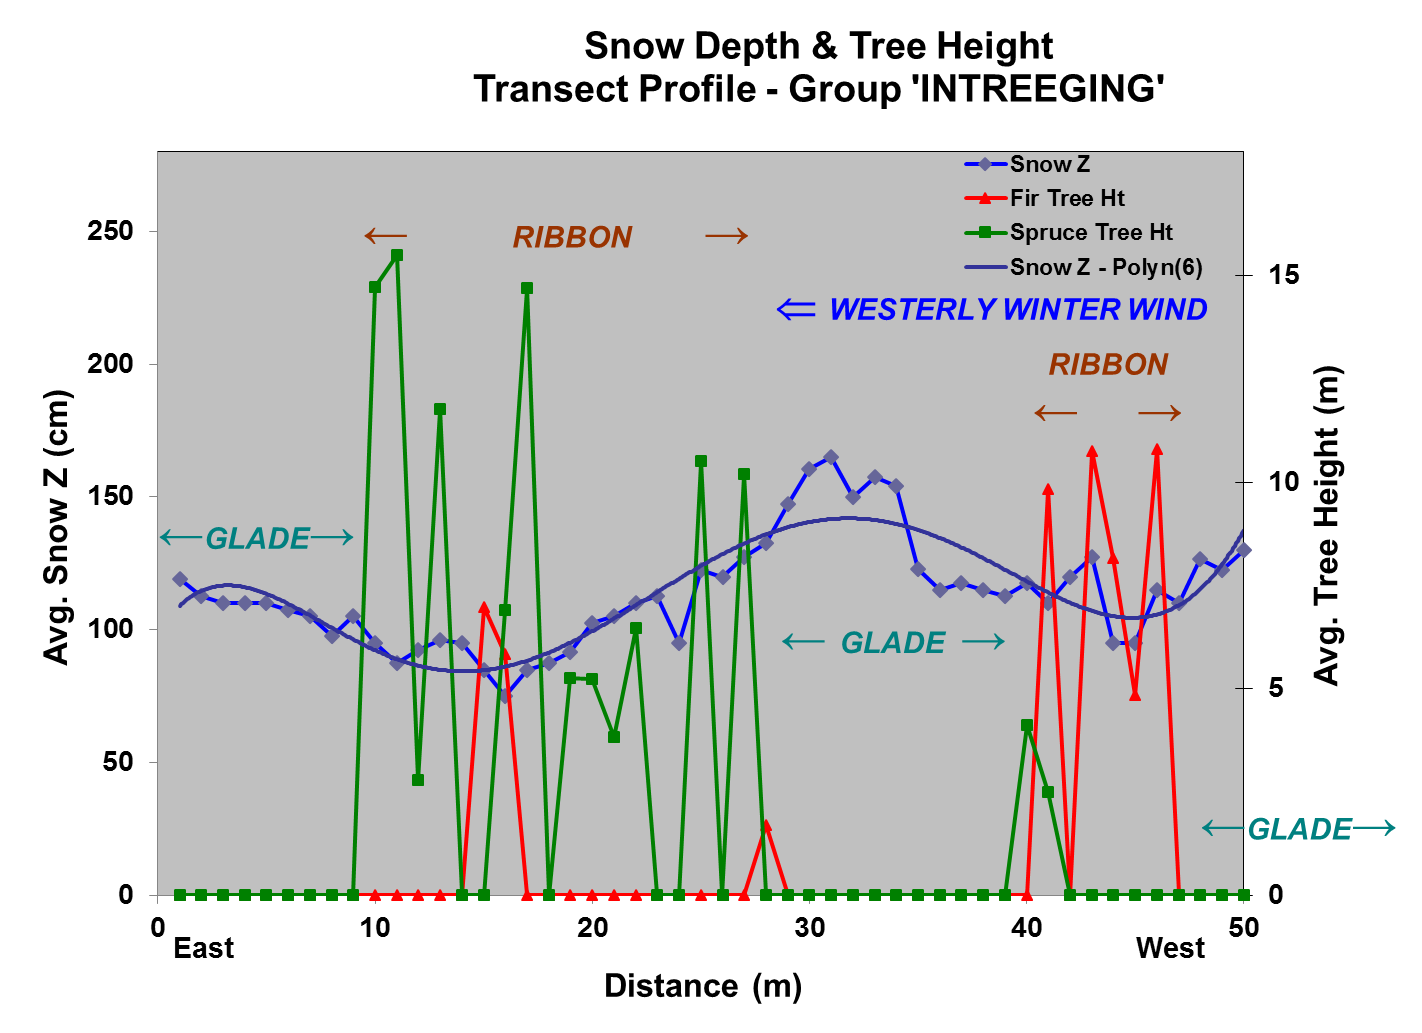
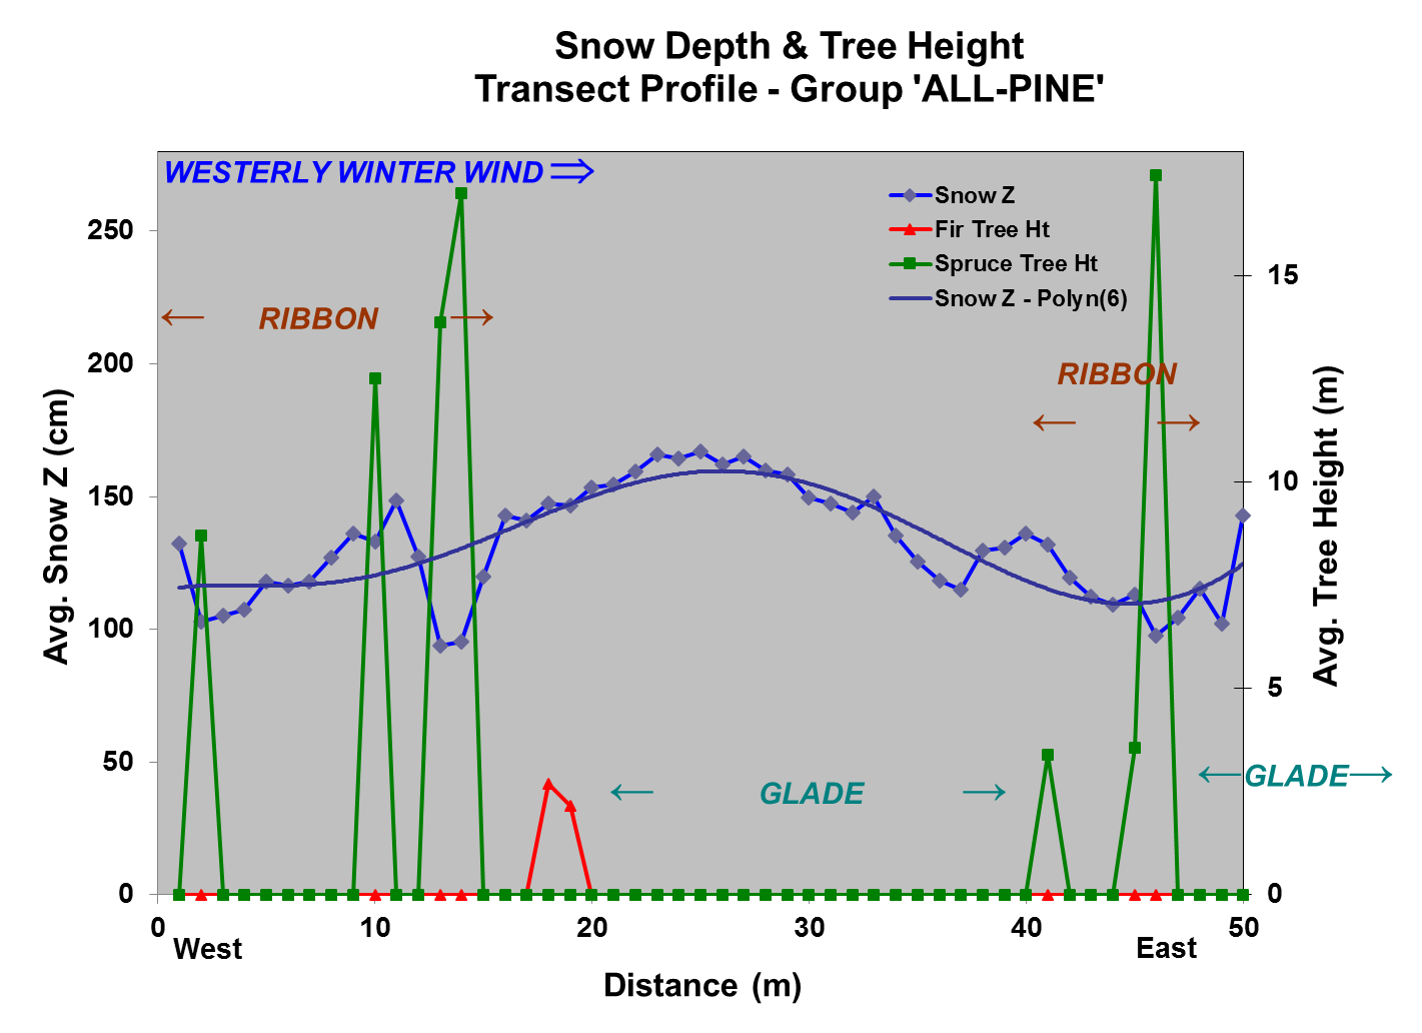
- Transect profiles: See selected images below,
others are in pdfs -
- Upper, western Transect "Intreeging" (xlsx,
pdf; 200k)
- Lower, eastern Transect "All-Pine" (xlsx,
pdf;
200k)
- Discussion and Interpretation - see
2013 notes, but in terms of this
year's data
click images to enlarge
Upper, western
Transect "Intreeging" (*)
|
Lower, eastern
Transect "All-Pine" (*)
|
* See
pdf for
images showing Tree Limit with respect to Snow
Depth
in terms of Tree Height, Density,
and DBH
|
* See pdf
for images showing Tree Limit
with respect to Snow Depth
in terms
of Tree Height, Density, and DBH
|
|
|
2016
|
2//16
- Transect data: See selected images below
- Western Transect (xls,
150k)
- Eastern Transect (xls,
150k)
- Discussion and Interpretation - see 2013 notes,
but in terms of this year's data
click images to enlarge
Western
Transect

Transect Profile

Tree Limit (shown by Tree Height) vs Snow Depth
(SnowZ)
- Note strong effect of SnowZ on Tree Ht at
intermediate depths
- Apparent Tree Limit at SnowZ ~120cm
(Observed SnowZ's go to ~230cm)
|
Eastern
Transect

Transect Profile
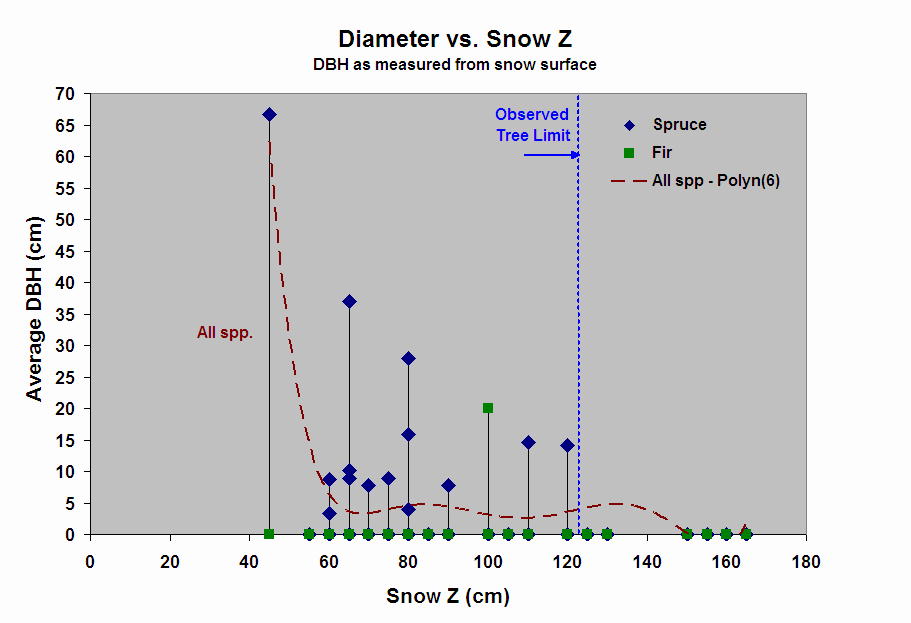
Tree Limit (shown by Tree Diameter) vs Snow
Depth
- Note strong effect of SnowZ on
DBH at intermediate depths
Apparent Tree Limit at SnowZ ~120cm
(Observed SnowZ's go to ~165cm)
|
|
click
images to enlarge
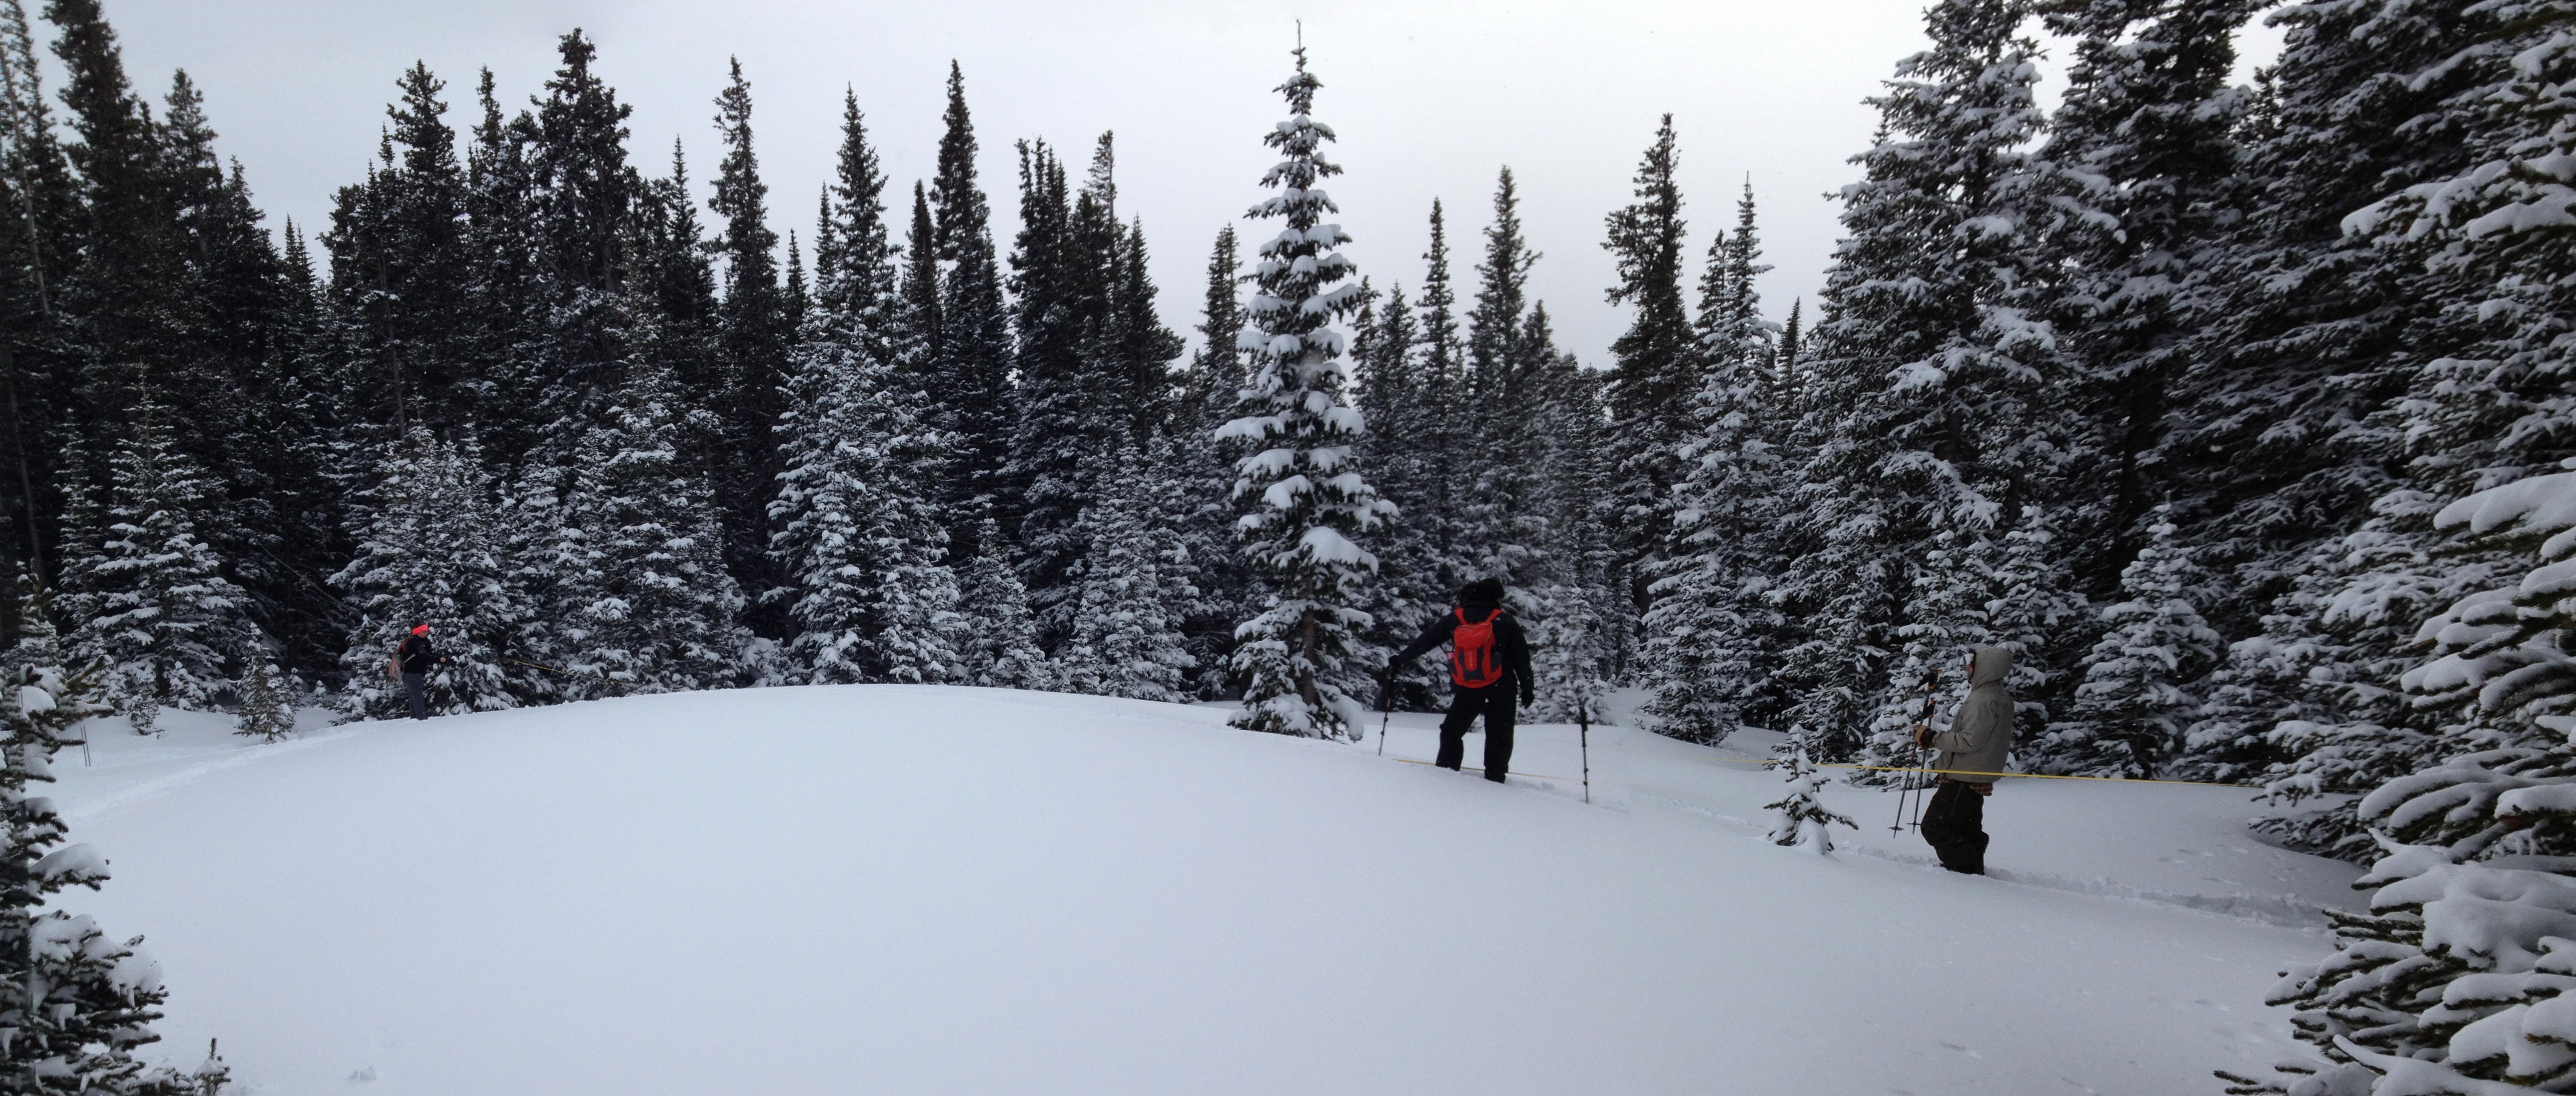
Western Glade, 2016 - Ribbon Forest
photo (c) T.Kittel
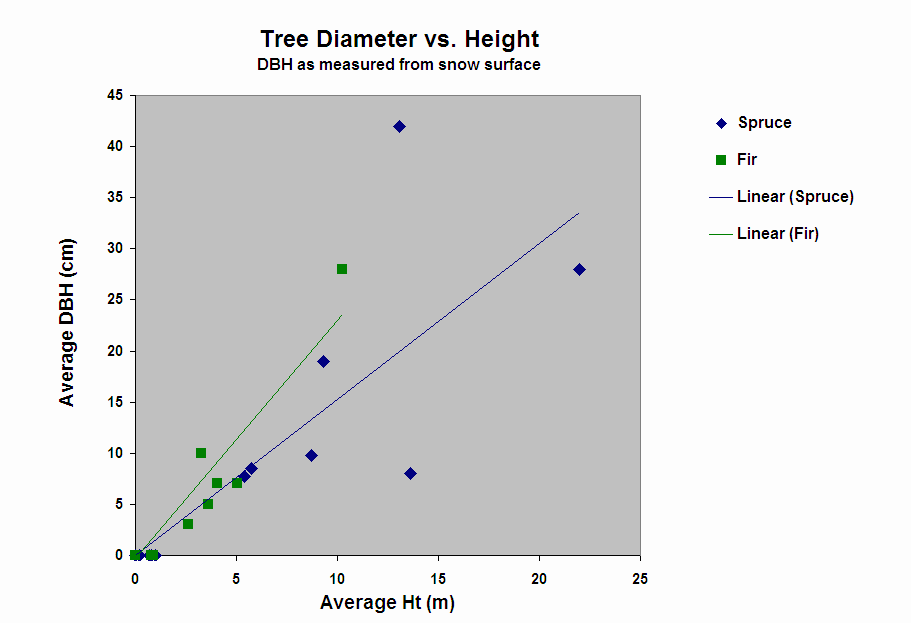 Relationship between DBH and Height, by species
Strong linear relationship, similar for the 2
spp. |
2015
|
2/7/15
- Transect graphs: See selected images below
- Western Transect (summary plots: pdf,
150k)
- Eastern Transect (summary plots: pdf,
150k)
- Discussion and Interpretation - see
2013 notes
click images to enlarge
Western
Transect

Transect Profile
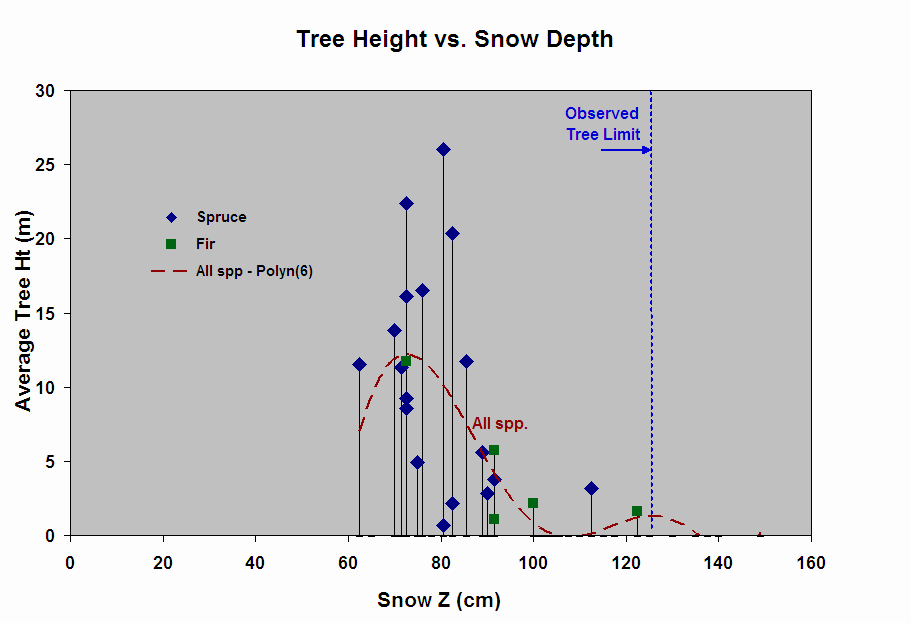
Tree Limit (shown by Tree Height) vs Snow Depth
(SnowZ)
- Note strong effect of SnowZ on Tree Ht at
intermediate depths
- Apparent Tree Limit at SnowZ ~125cm
(Observed SnowZ's go to ~150cm)
|
Eastern
Transect
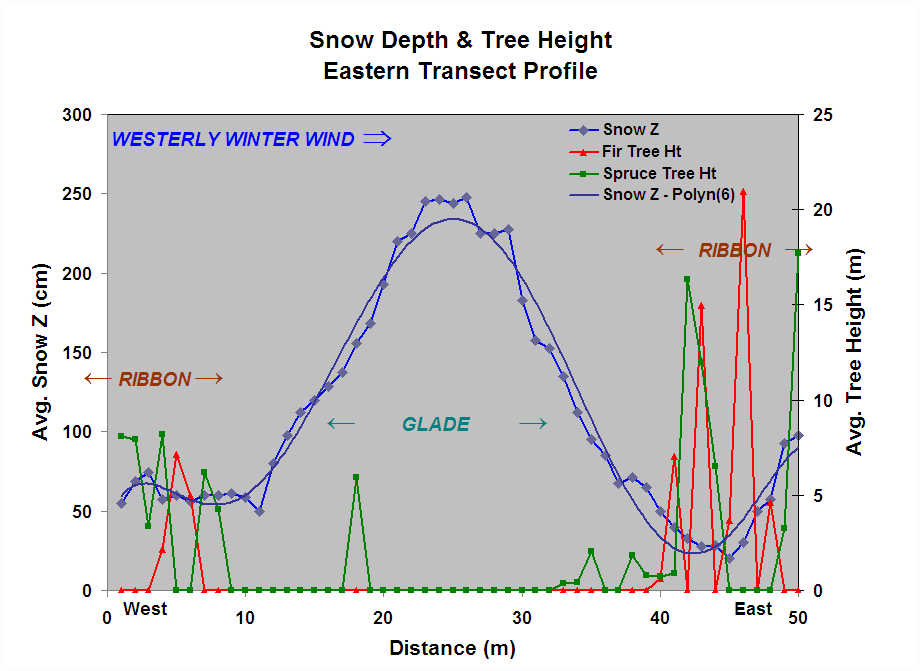
Transect Profile
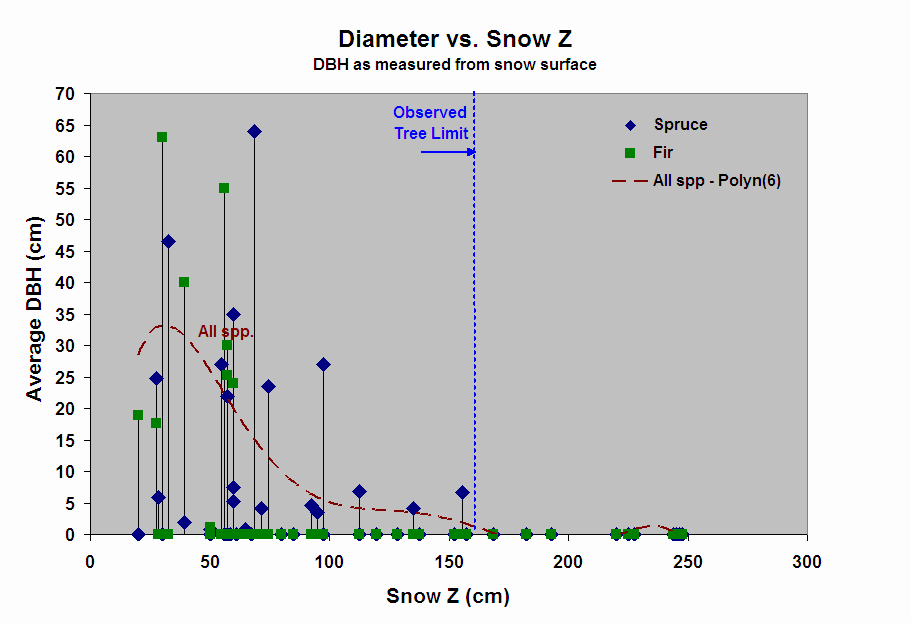
Tree Limit (shown by Tree Diameter) vs Snow
Depth
- Note strong effect of SnowZ on
DBH at intermediate depths
Apparent Tree Limit at SnowZ ~160cm
(Observed SnowZ's go to 250cm)
|
|
|
|
|
2014
|
2/15/14
- Transect graphs: See selected images below
- Western Transect "Yeti" (summary plots: pdf,
150k)
- Eastern Transect "Tauntaun" (summary plots: pdf,
150k)
- Discussion and Interpretation - see 2013
notes
click images to enlarge
Western
Transect (Yeti group)

Transect Profile
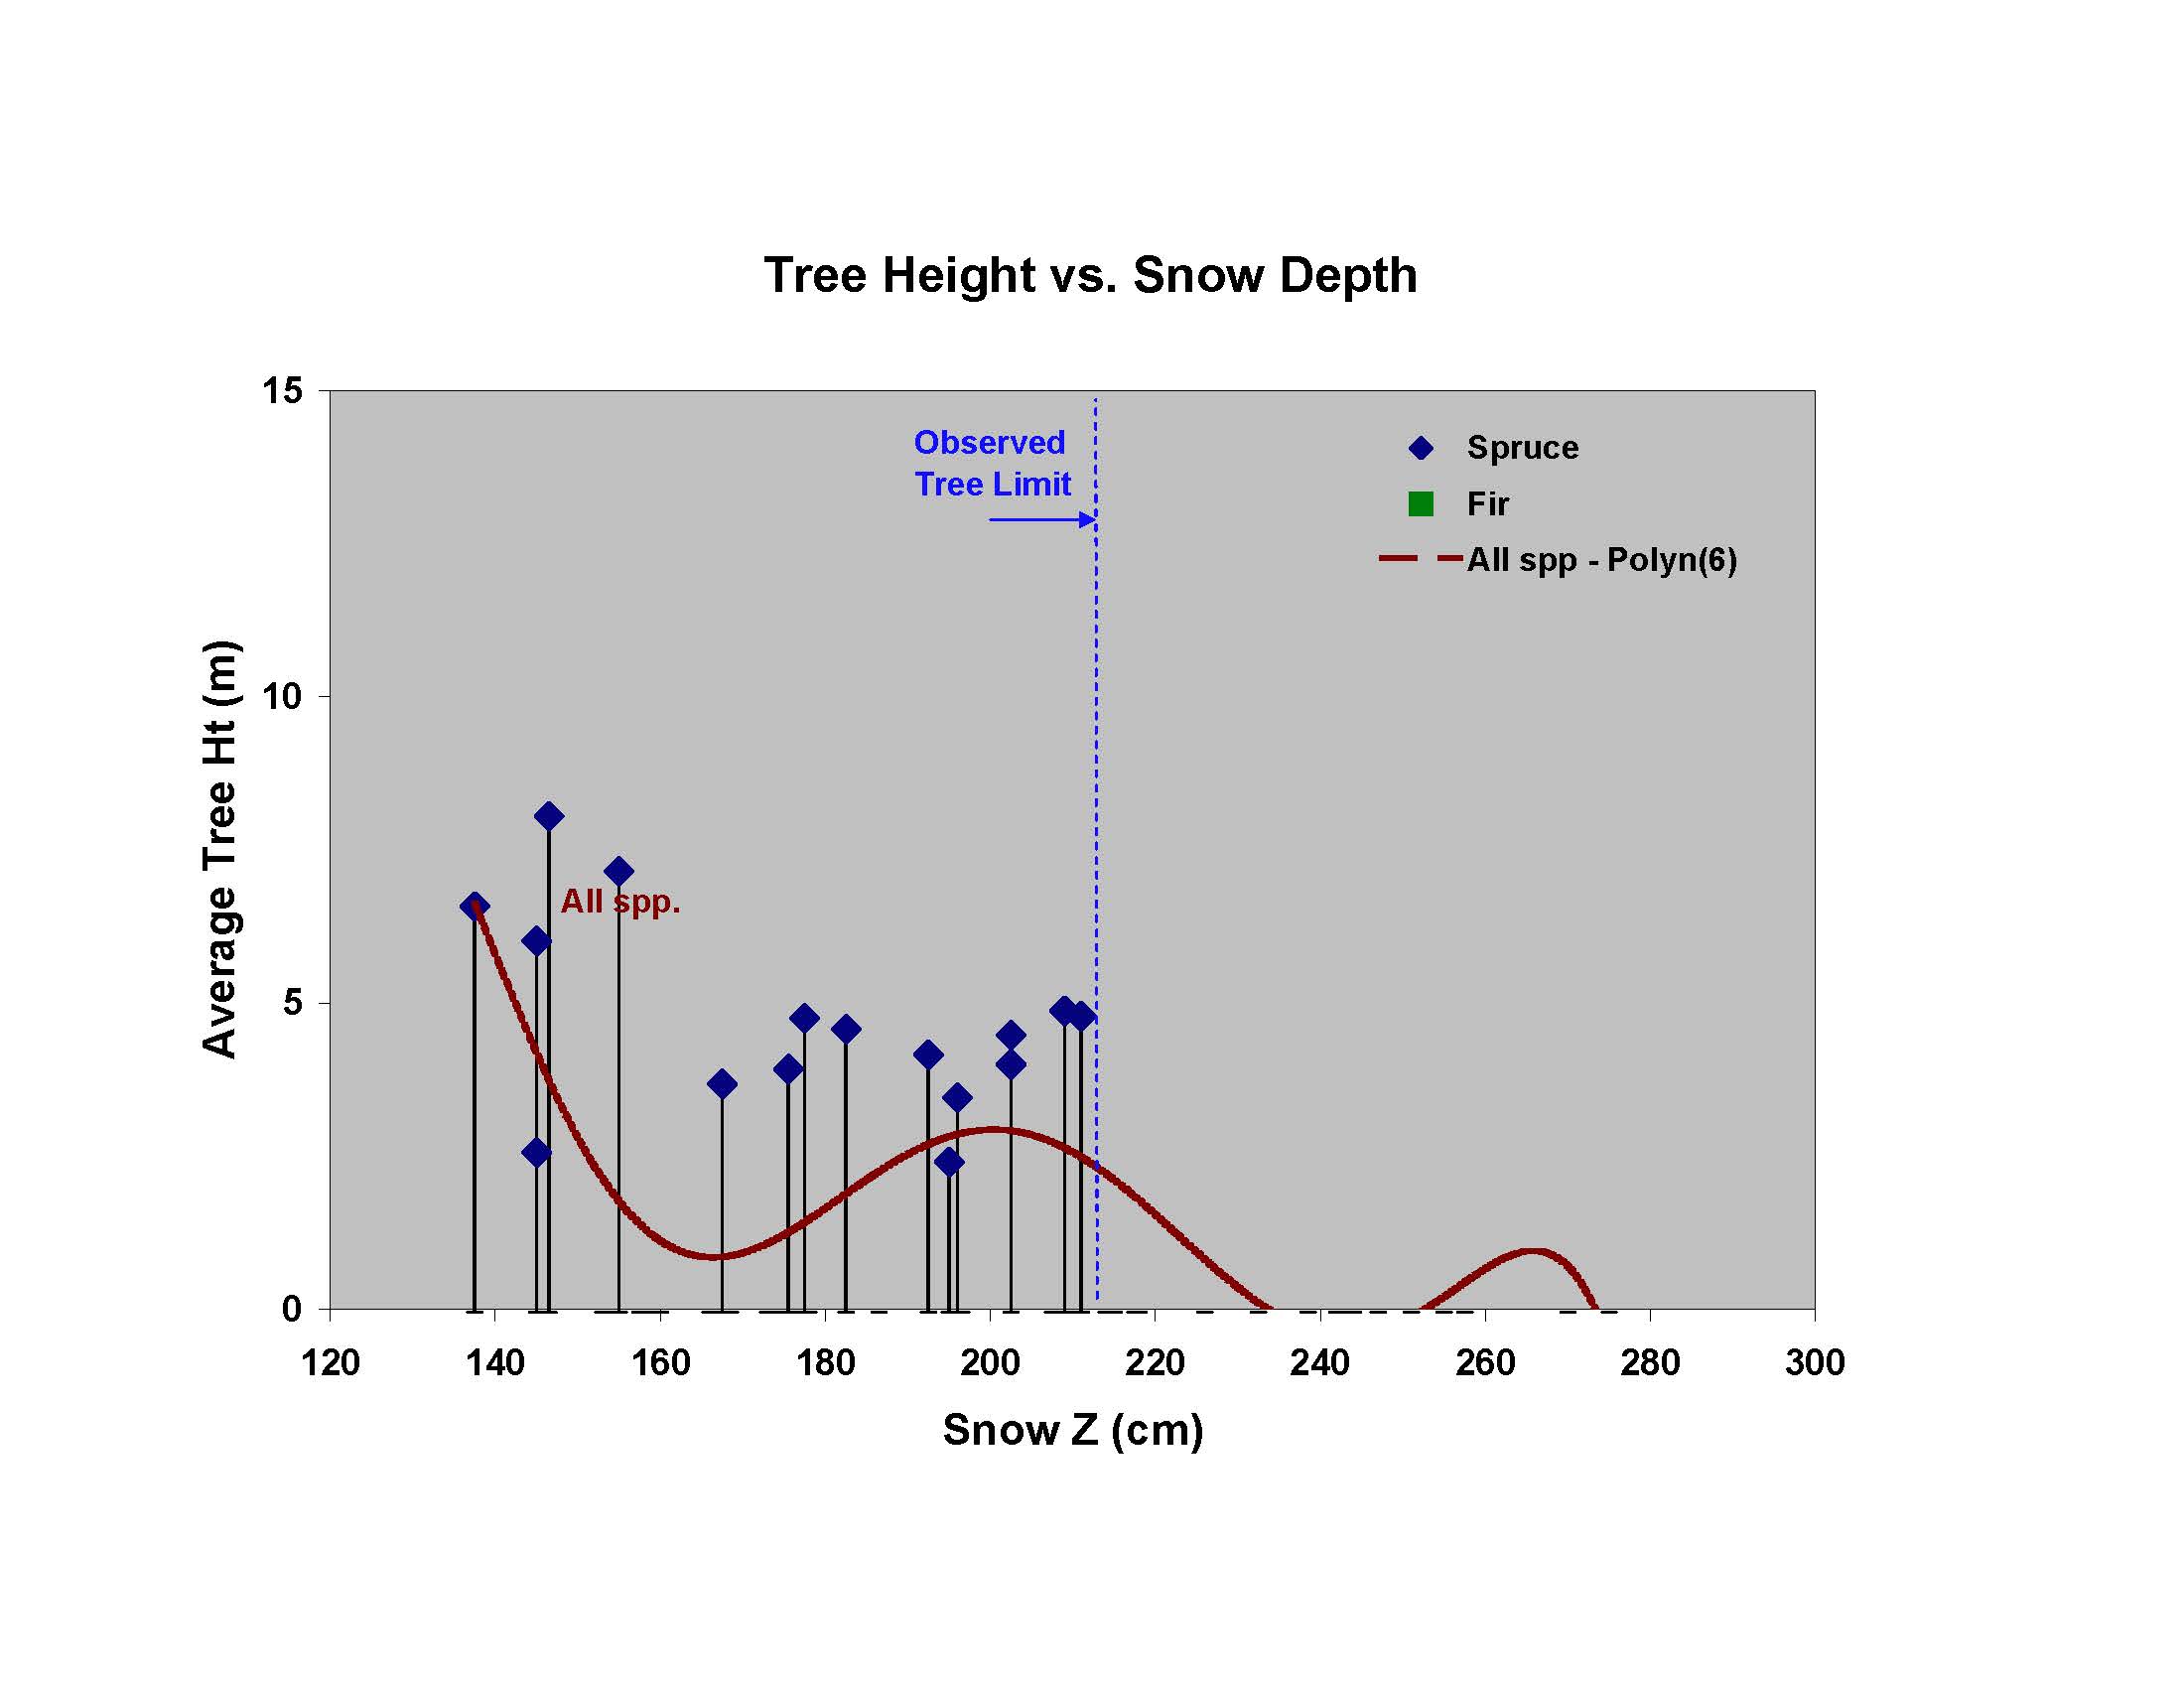
Tree Limit (shown by Tree Height) vs Snow Depth
(SnowZ)
- Apparent Tree Limit at SnowZ ~215cm
(Observed SnowZ's go to 275cm)

Tree Limit (shown by Tree Diameter) vs Snow
Depth
- Note strong effect of SnowZ on
DBH at intermediate depths,
vs that on Tree Ht. for this Transect
|
Eastern
Transect (Tauntaun group)
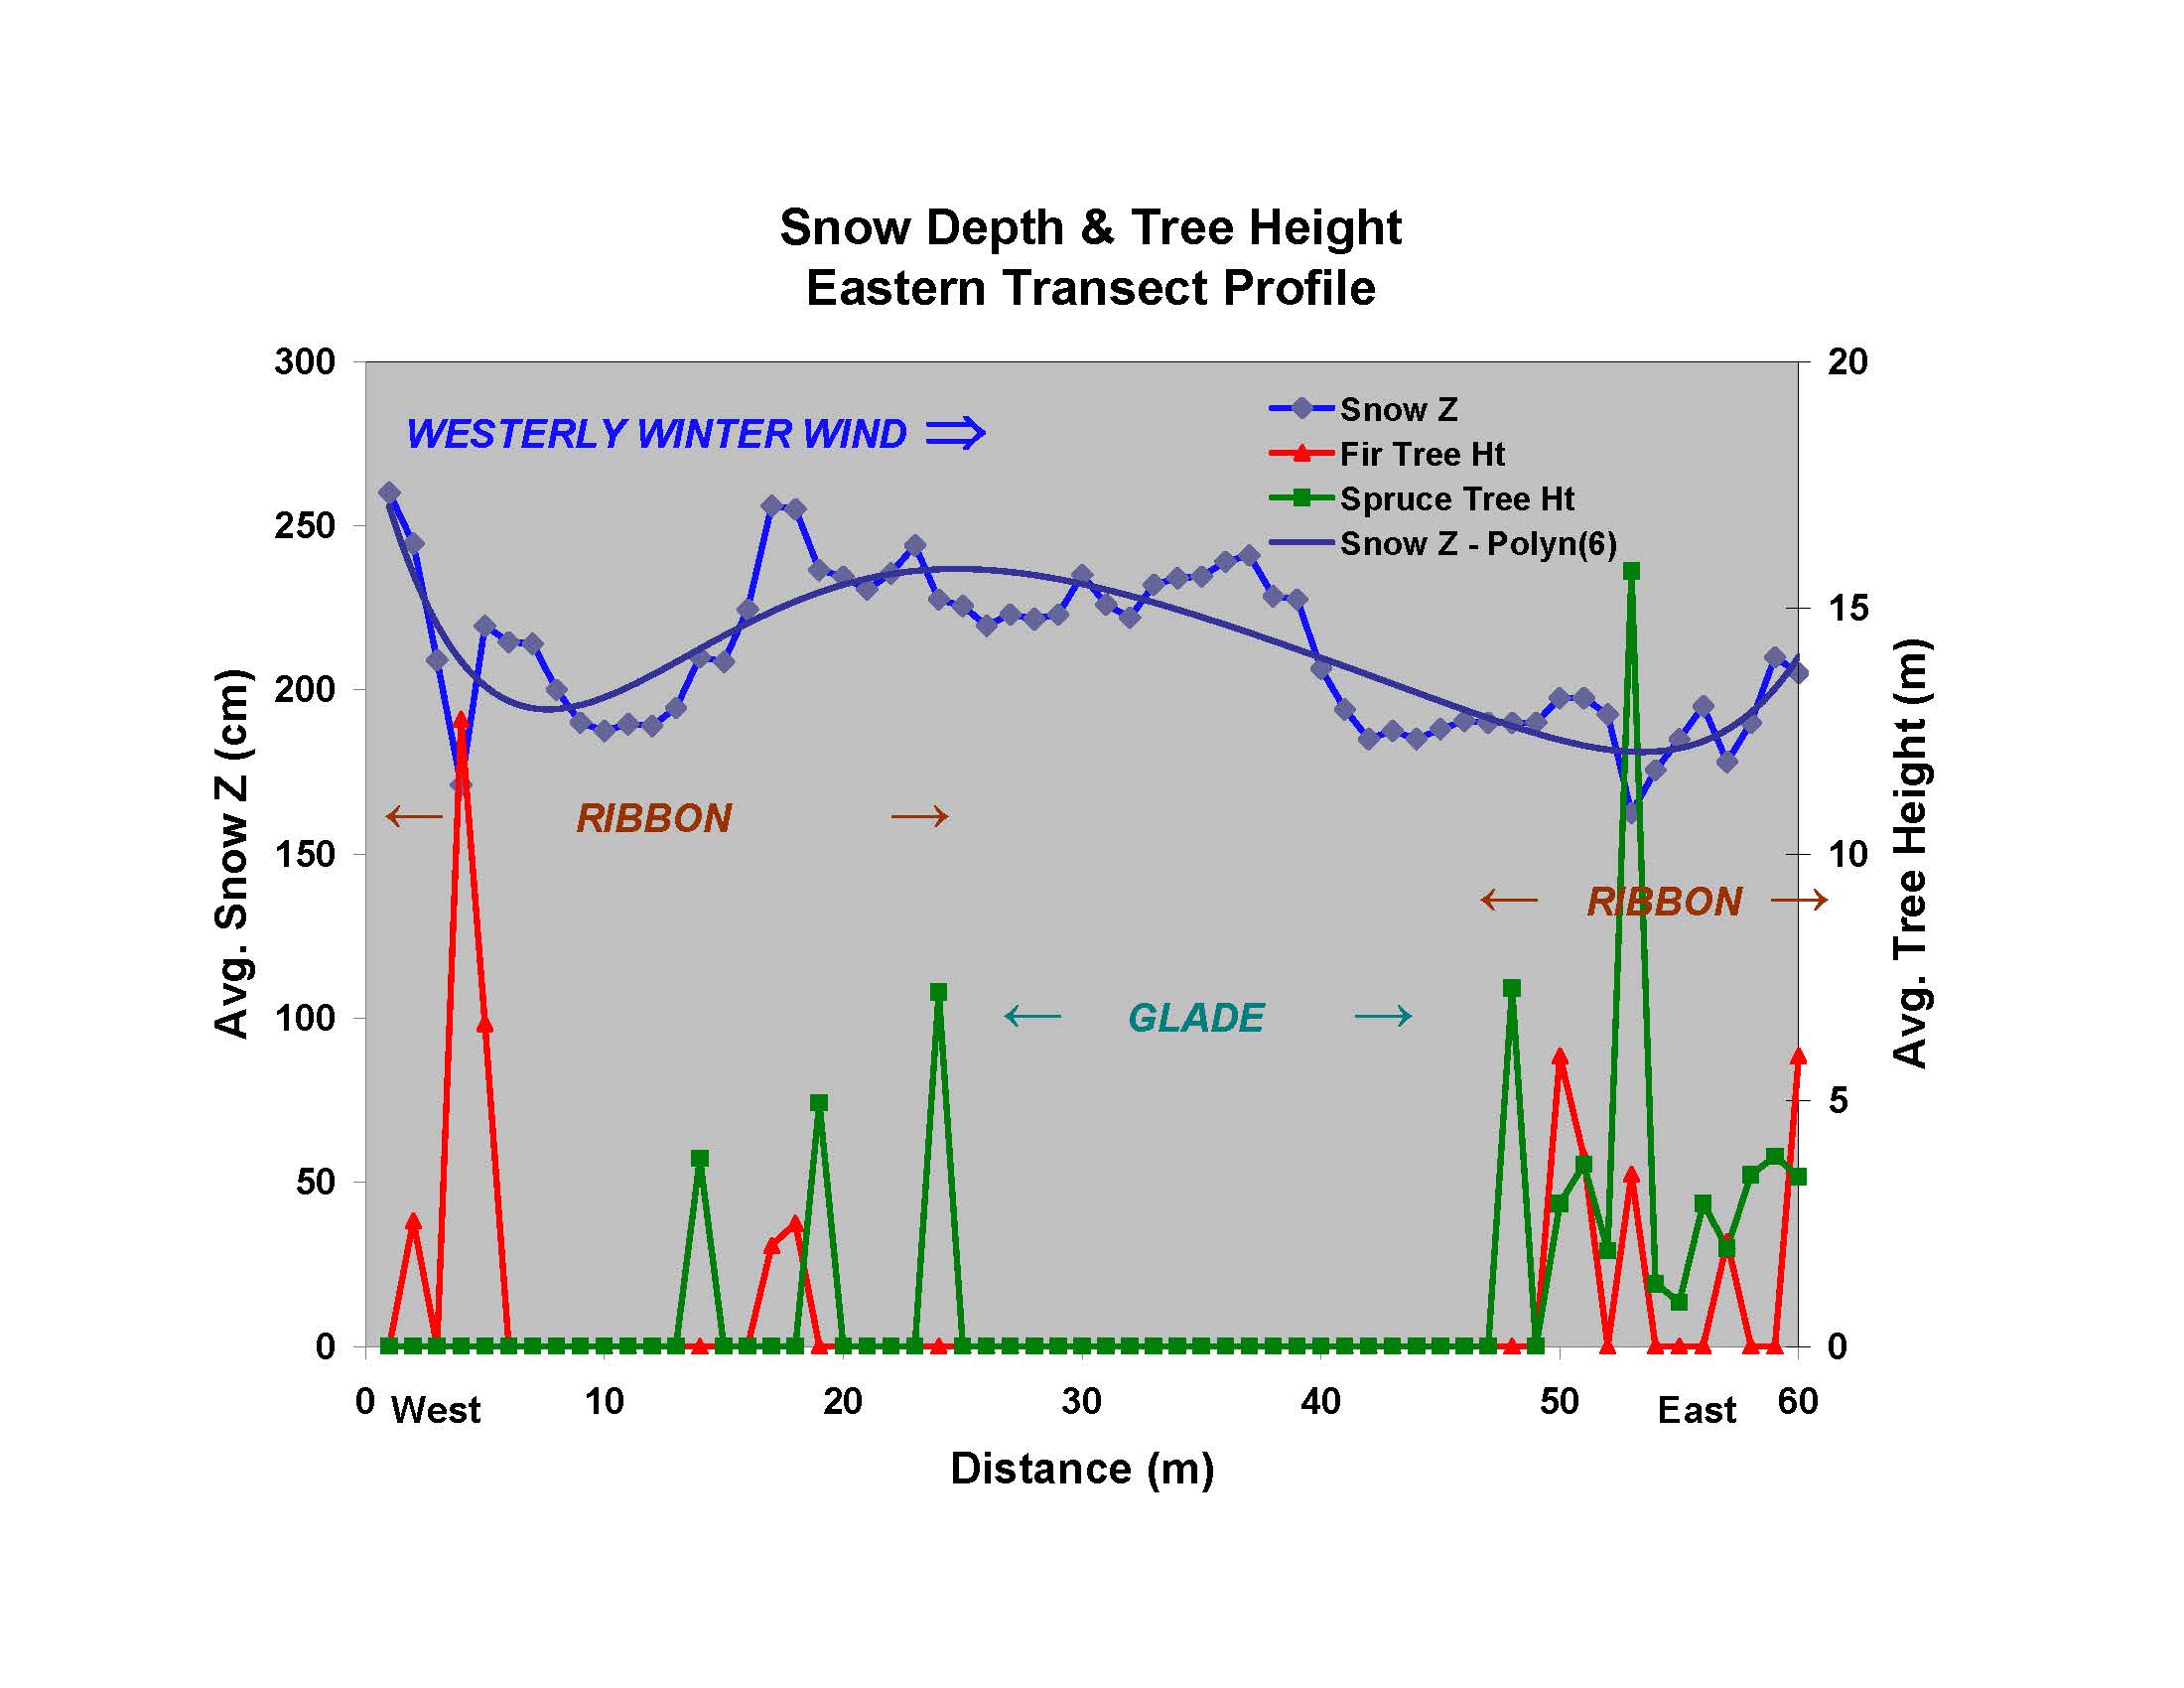
Transect Profile
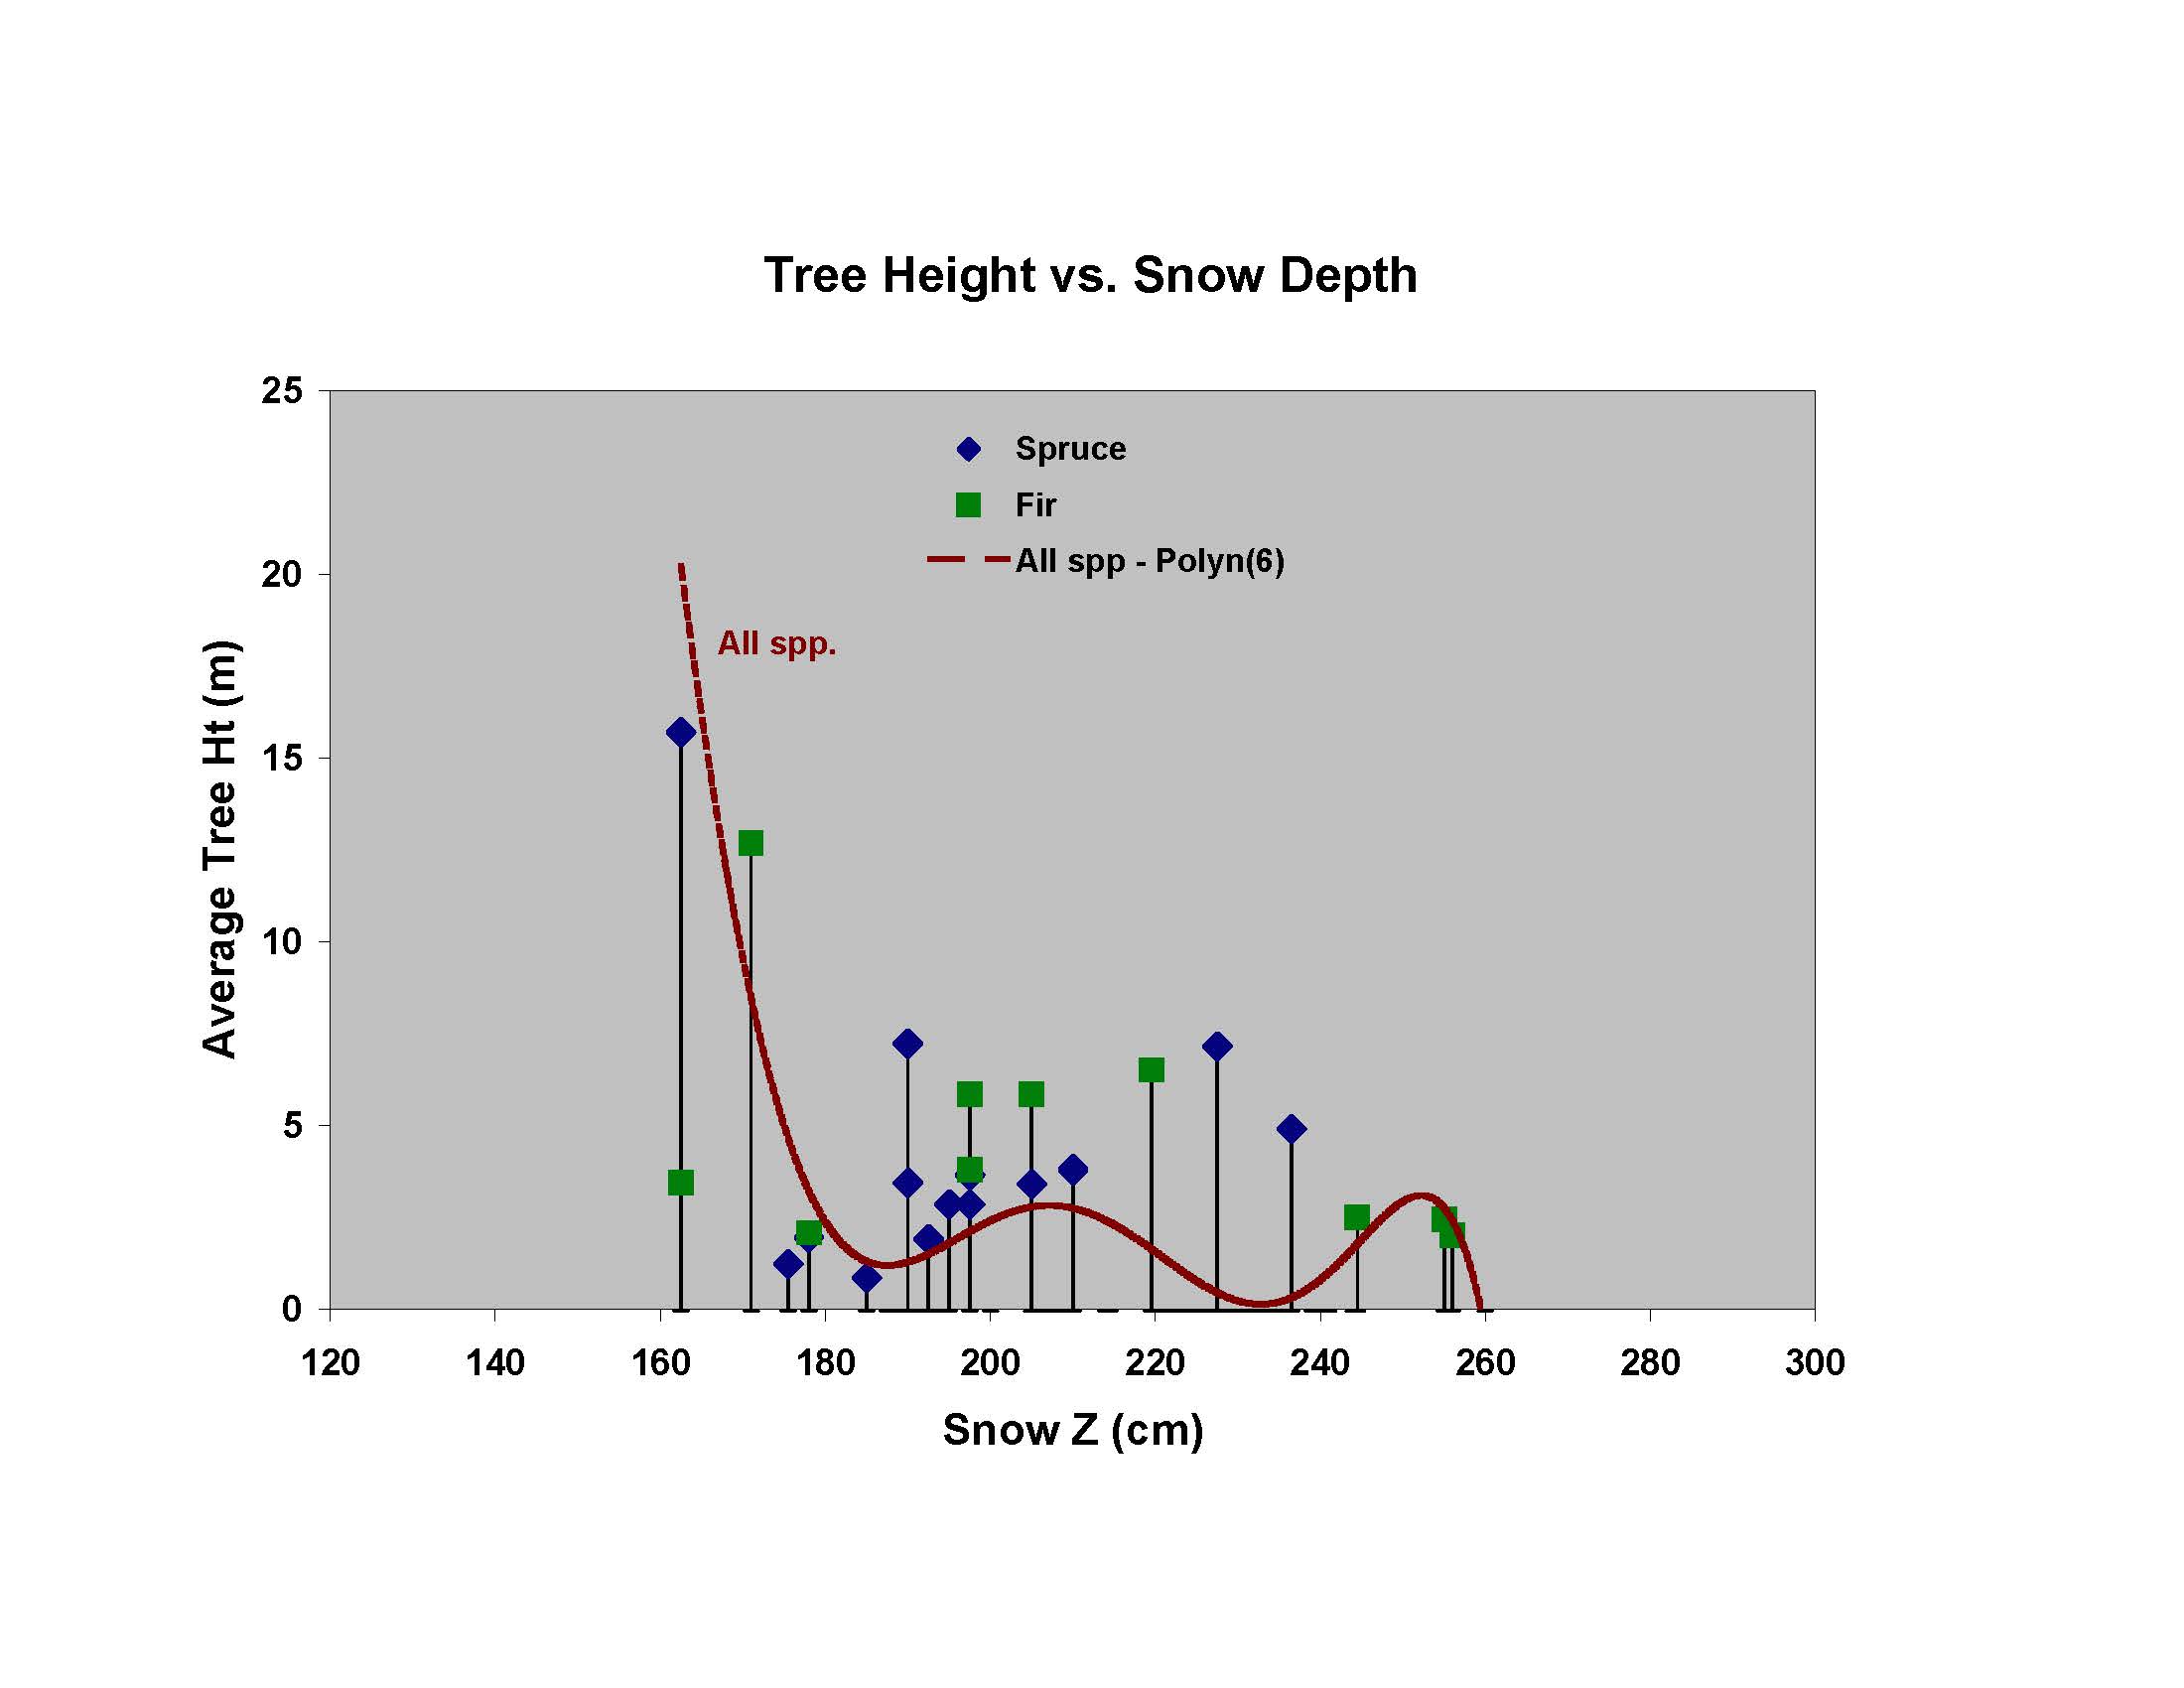
Tree Height vs Snow Depth
- Note strong effect of
SnowZ on Tree Ht at intermediate depths,
- No apparent Tree Limit (no high SnowZ's w/o
trees) vs as in Western Transect
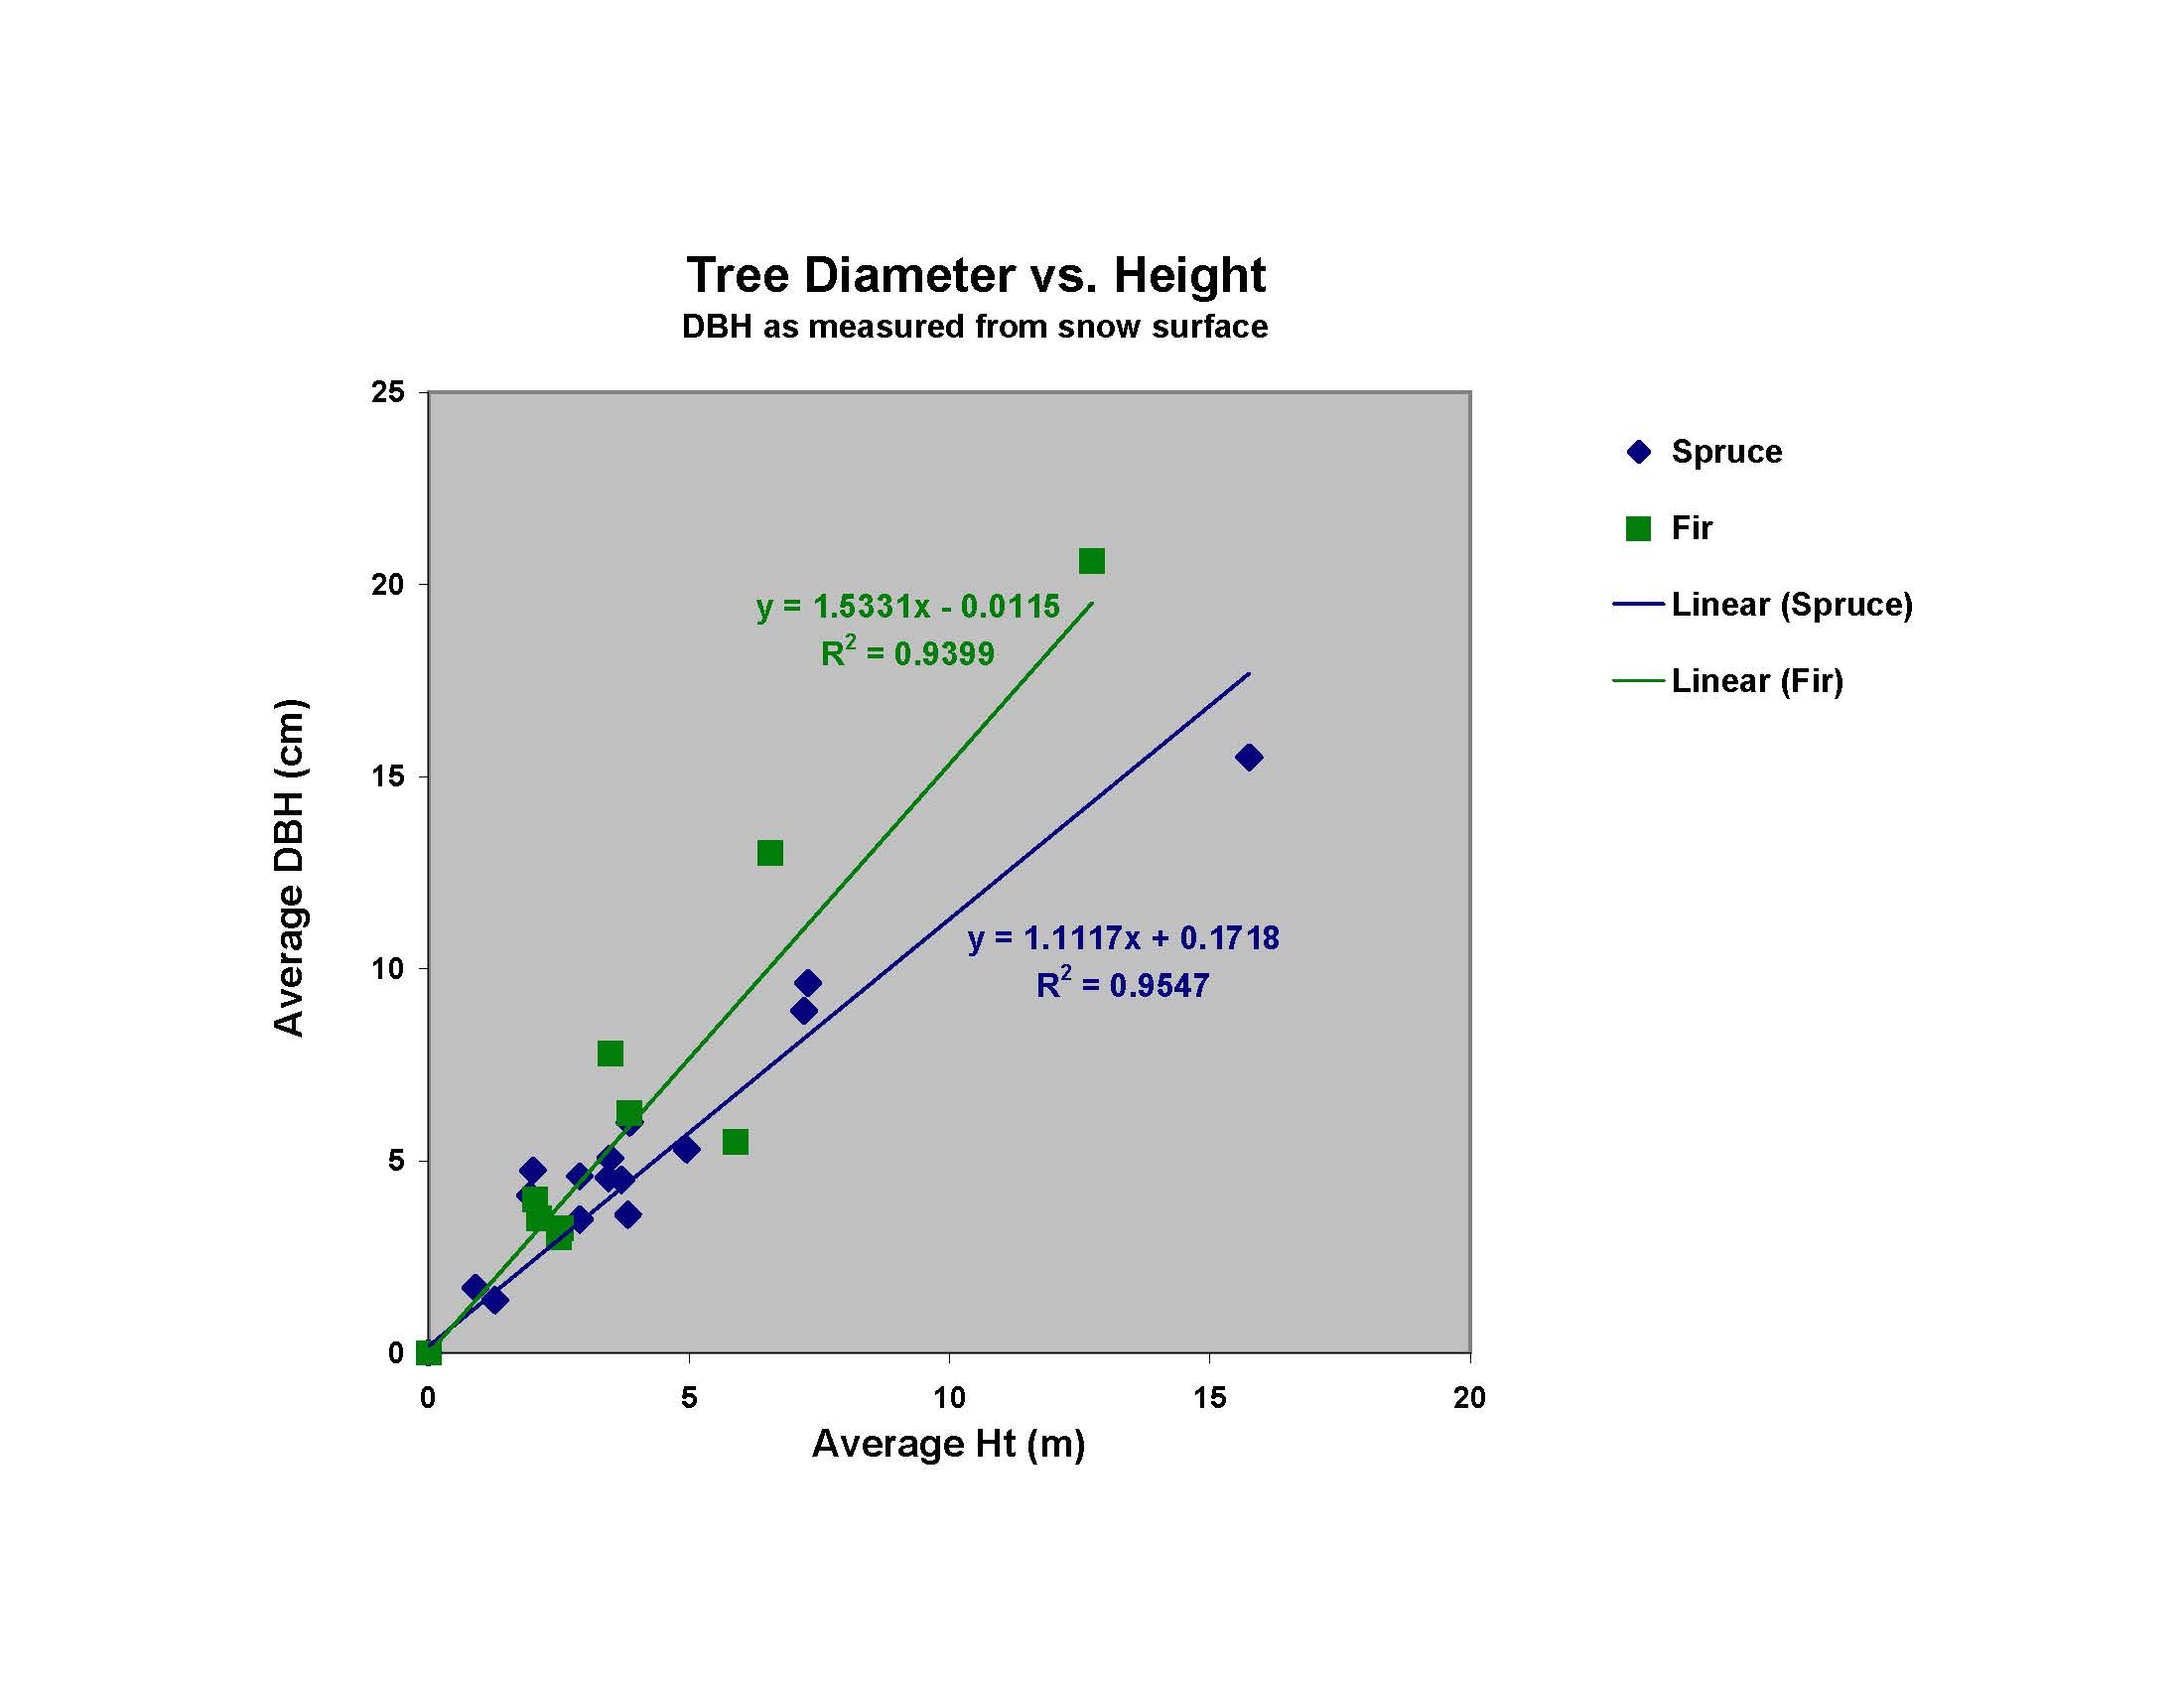
Relationship between DBH and Height, by species
Strong linear relationship, similar for the
2 spp.
|
|
photos - click to
enlarge
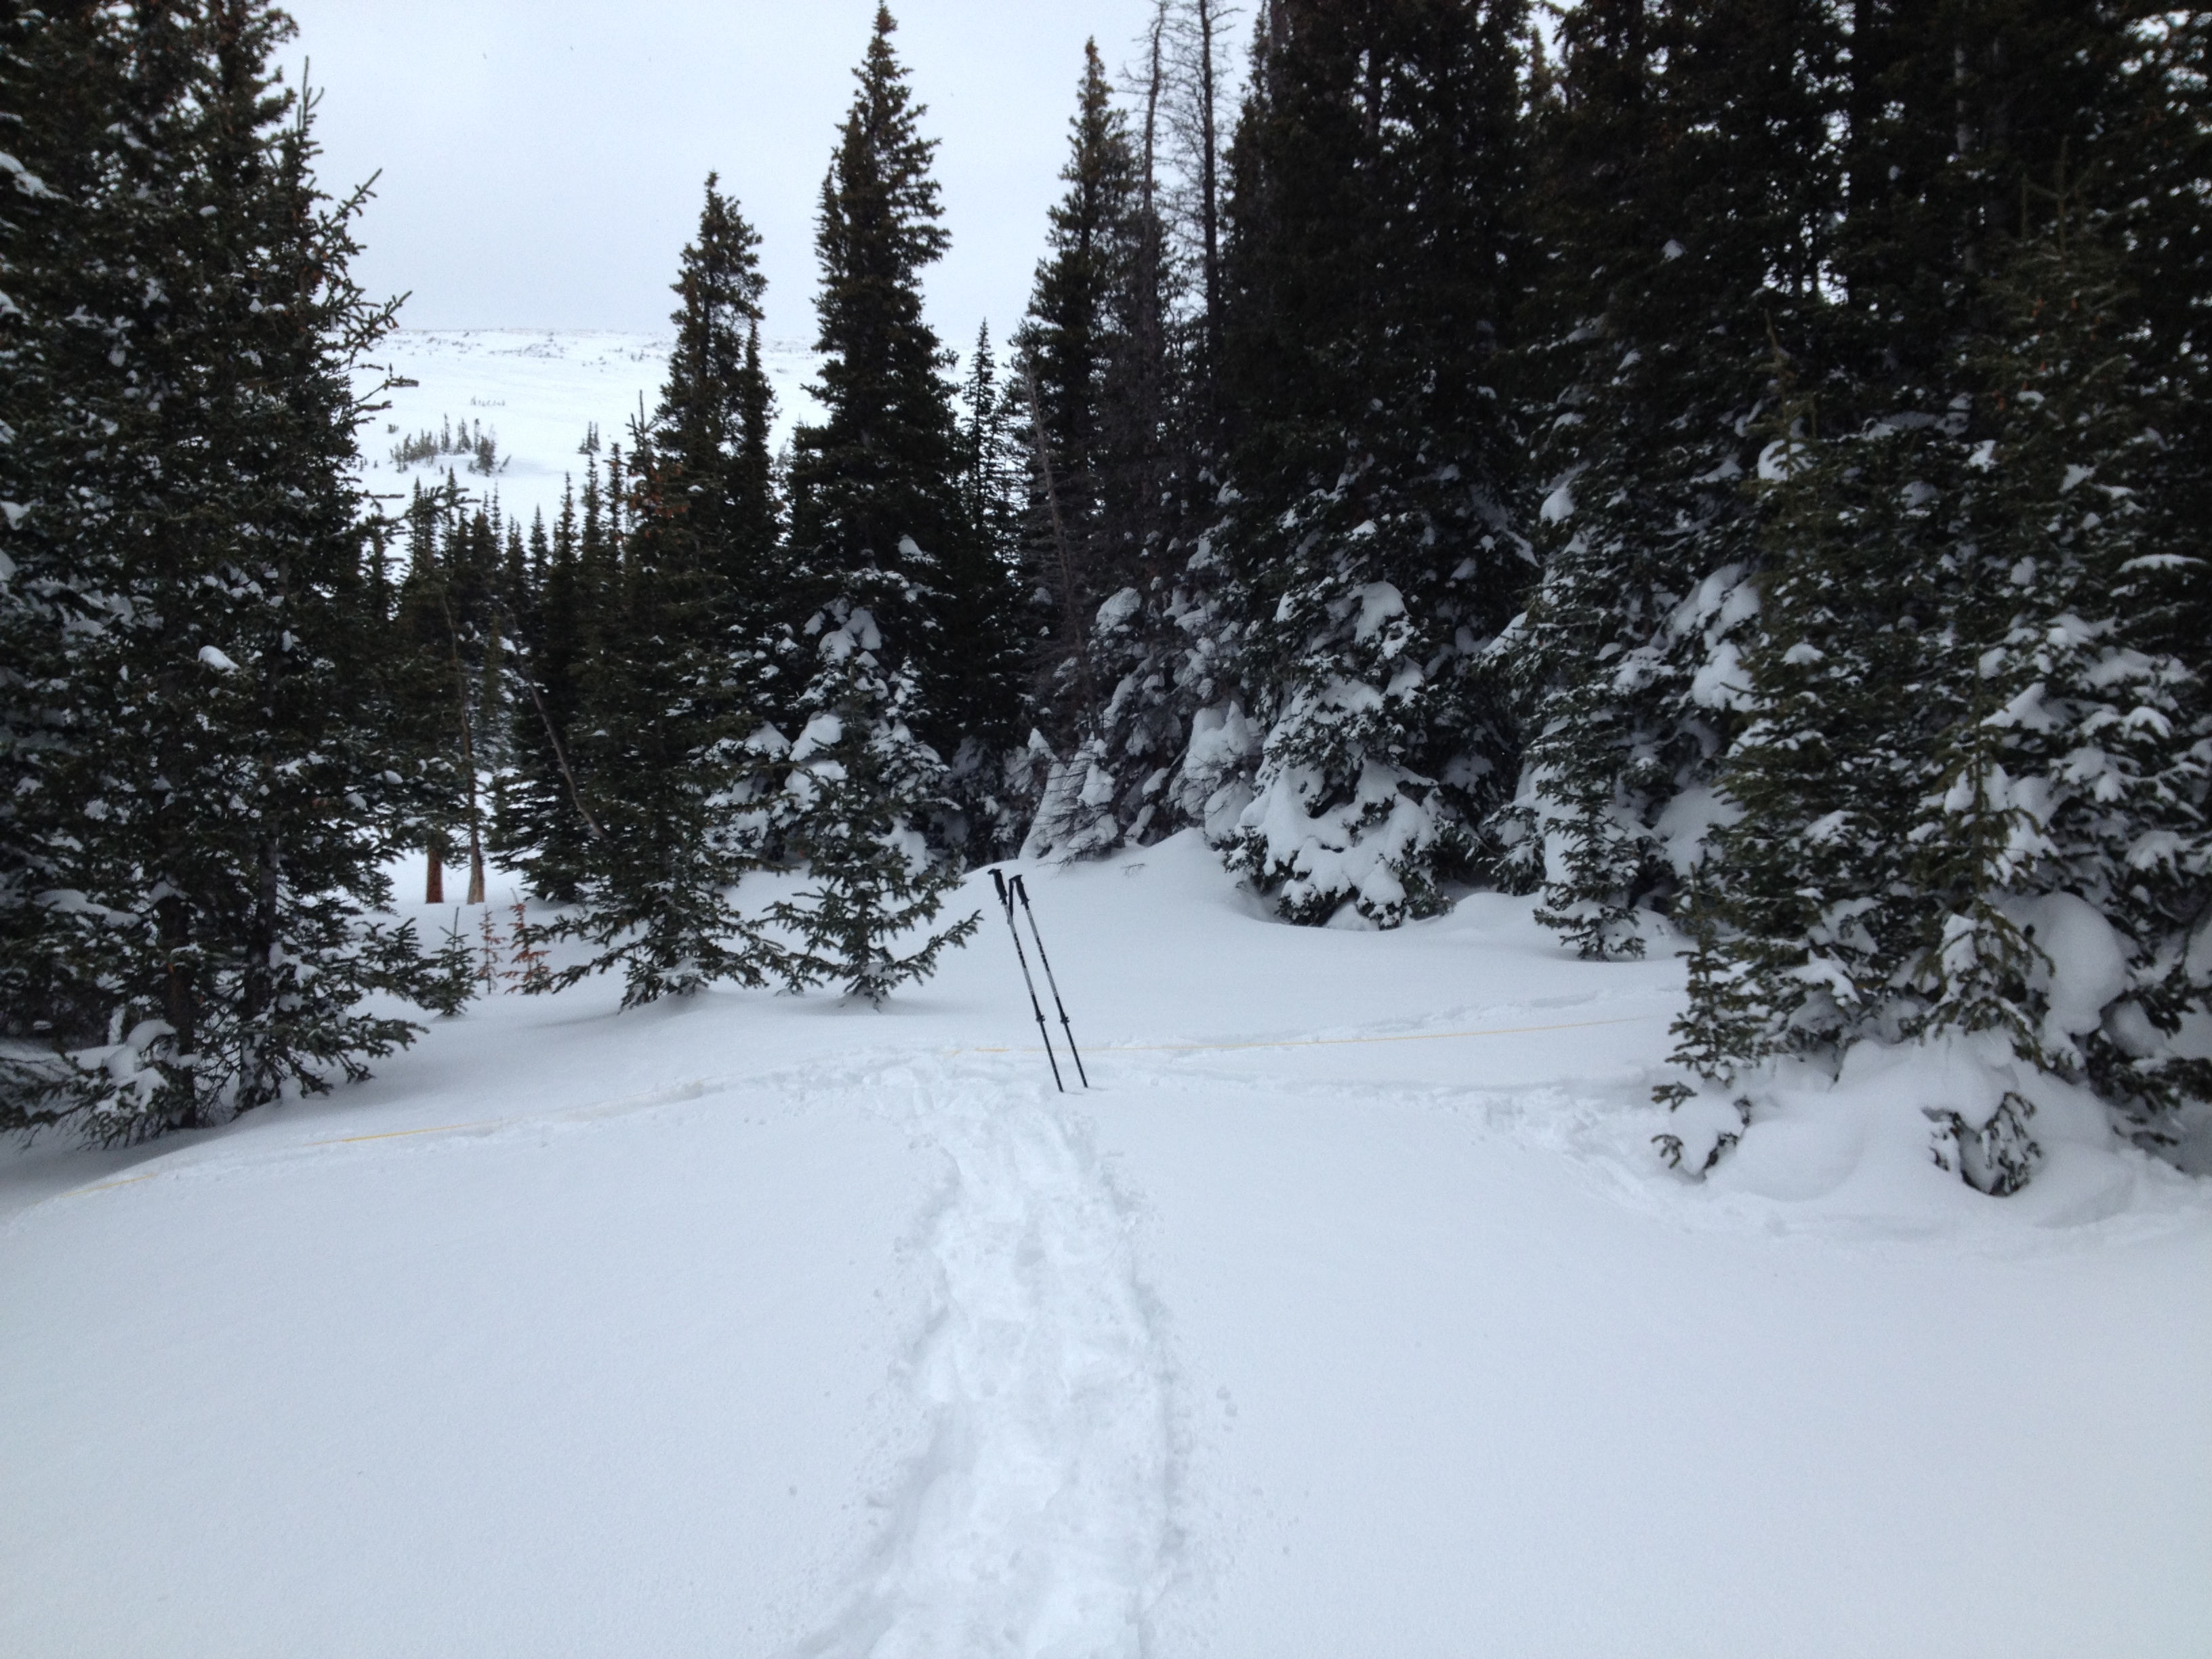
Western
Transect - Glade at 40m
Western
Transect - Group Yeti in part
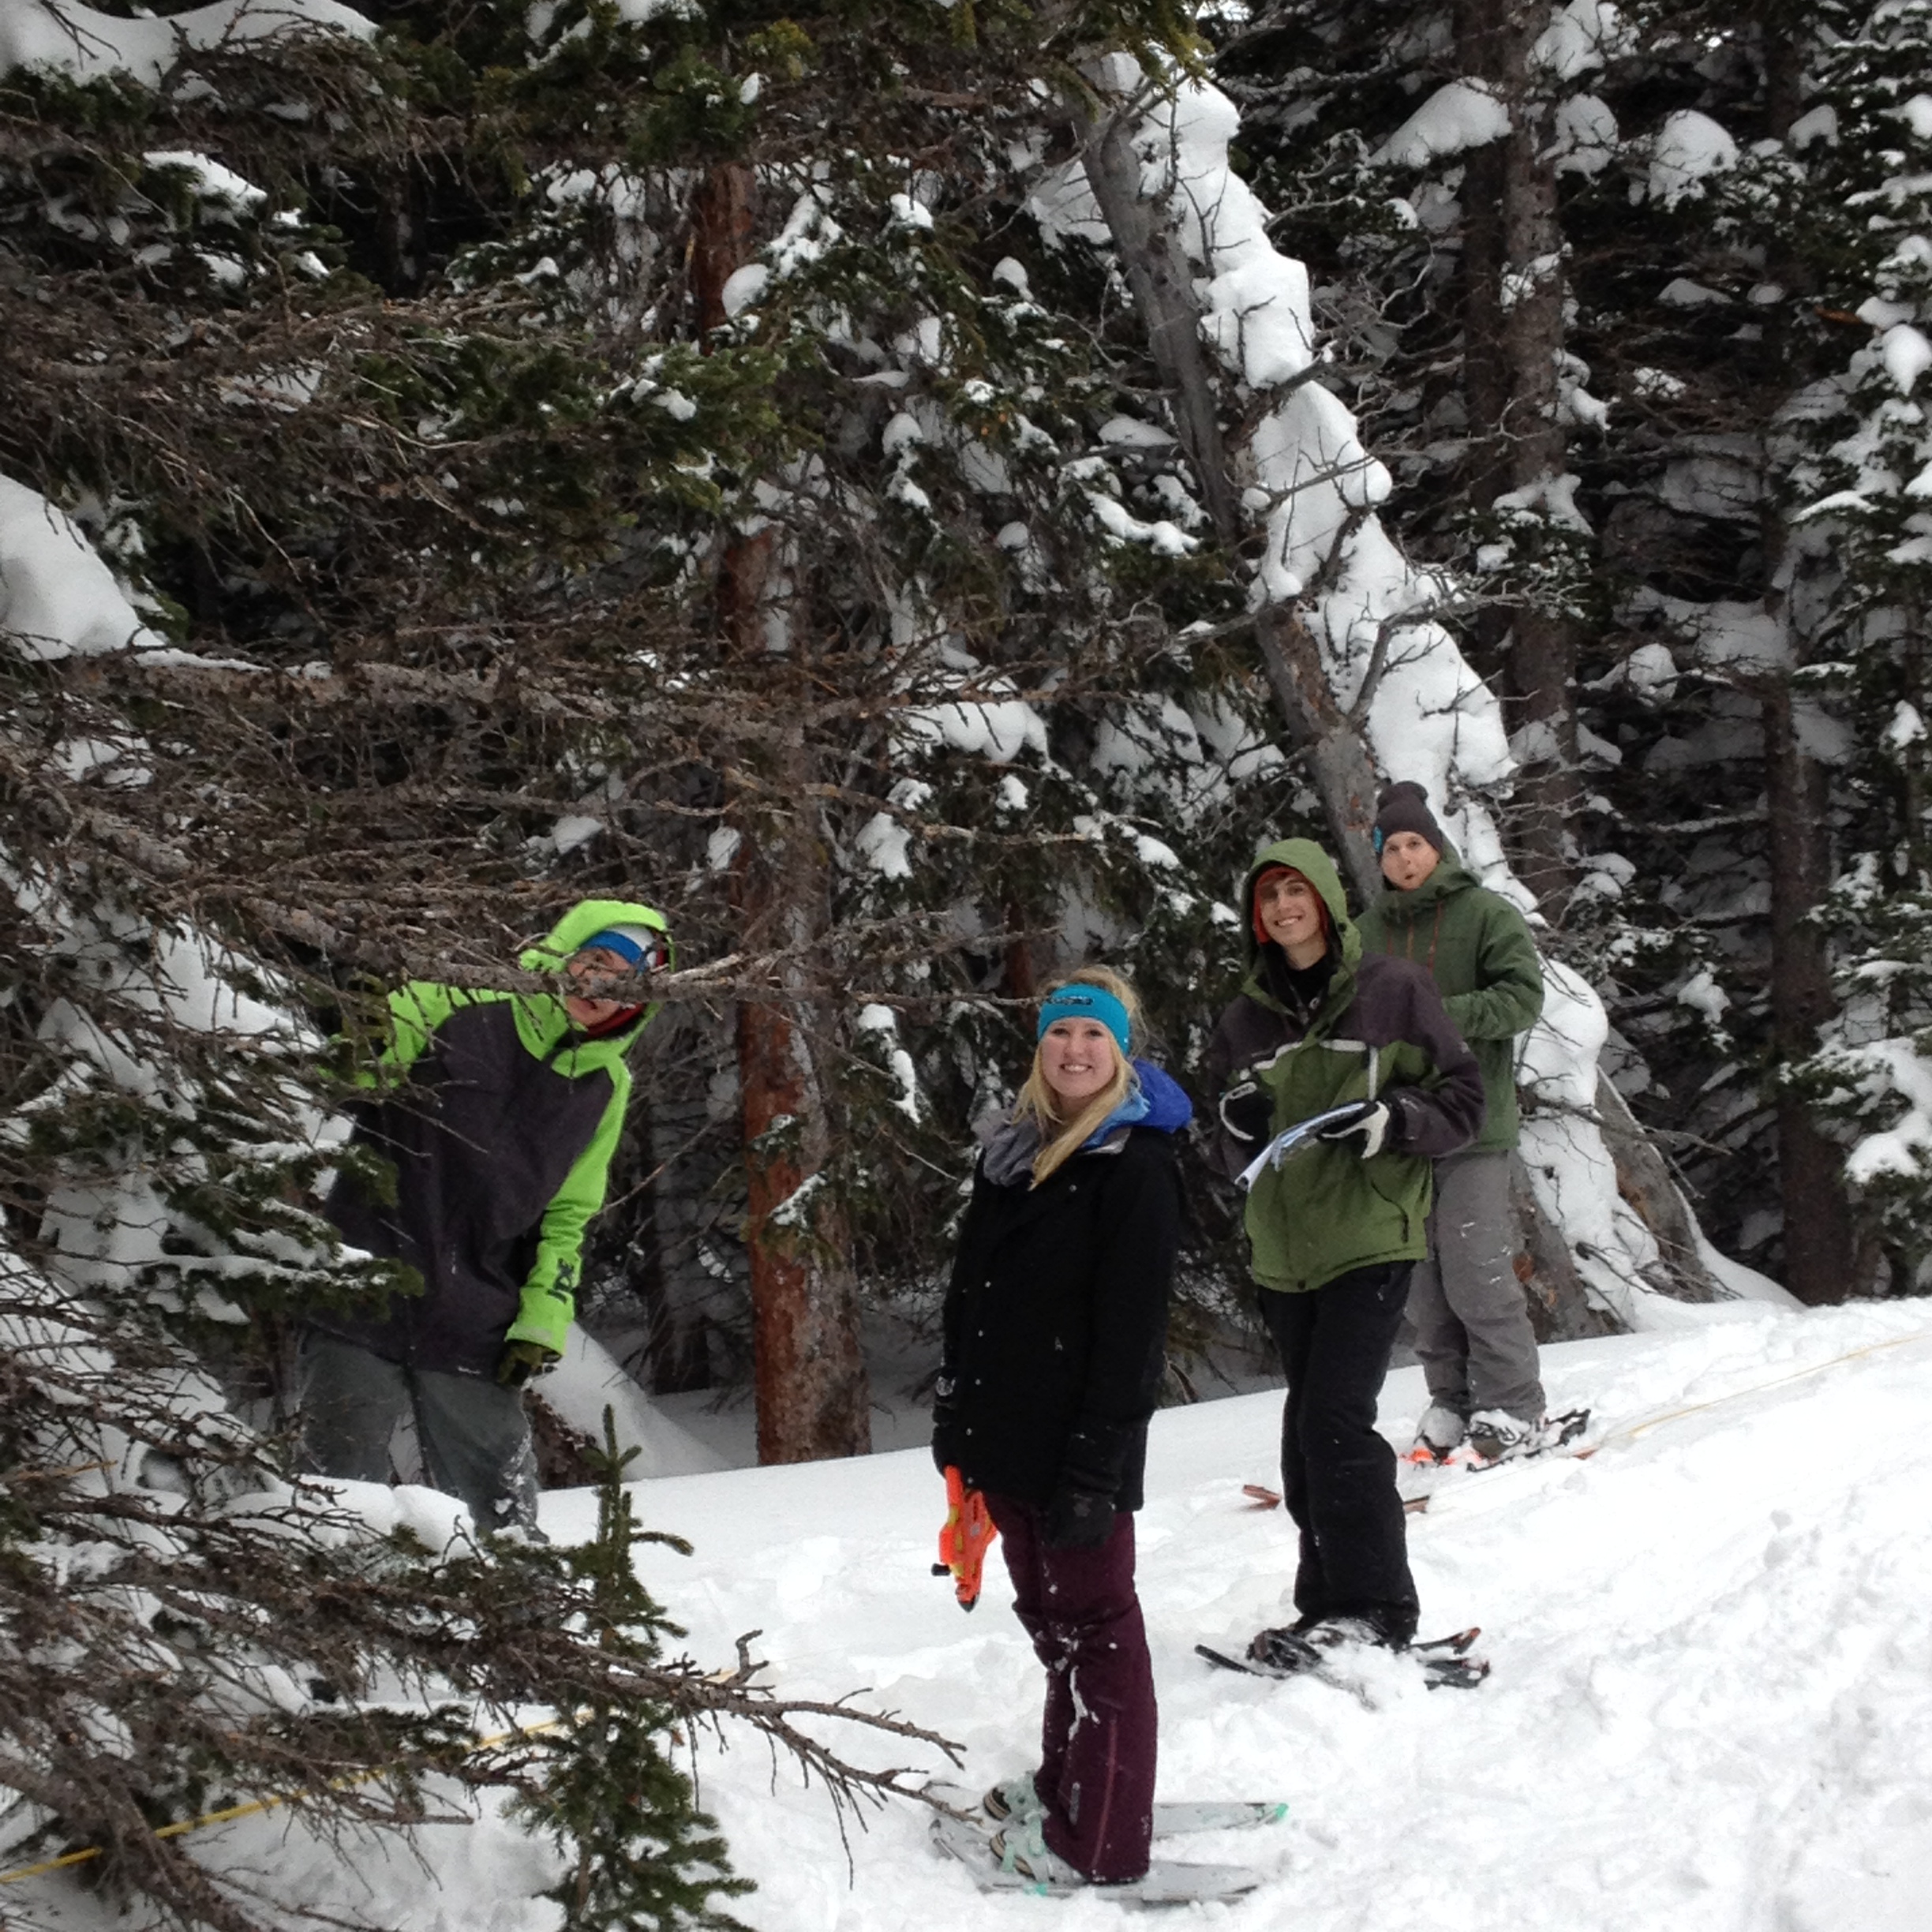
Eastern Transect - Opening
~10m,
Group Tauntaun
Eastern
Transect - Main Glade at ~30m,
Group
Tauntaun
|
| 2013 |
2/1/13
- Transect 1&2 graphs composite (pdf,
250k) - see below for image of Upper Transect
- Spreadsheets (do not "Update" on opening)
- Lower Transect (Summary xls,
160k)
- Upper Transect (Summary xls,
160k)
- Discussion --
- What are the questions we
sought to address in this field study? --
The key ones were:
- What is the structure of
the Ribbon Forests?
- Why is this landscape
structured into Ribbons and Glades?
- To illustrate structure of
the forest itself, what is the frequency of
individuals (# Individuals) in different size
classes?
- Size classes can be by
Tree Height [which we plotted in the board, below]
or by DBH.
- How does this contrast to
that for the Subalpine Forest proper, based on
our casual observations lower down?
- From the Ribbon Forest results,
what relationship did you observe between presence
of trees (or the height of trees) and snow depth?
- In this case, which
variable (Tree Ht, Snow Z) is the independent
variable and which the dependent?
- What mechanisms can you
suggest that support the argument either
way? [hint: see board
discussion, below]
That is,
- How might Snow Z affect
Tree Ht?
- How might Tree Ht
influence Snow Z?
- What is the main story,
then, on how the Ribbon Forests are formed,
maintained, and propagated?
- Based on this interpretation
-- Which forest (Ribbon Forest vs. Subalpine
Forest proper) is predominately structured by
biotic processes vs. abiotic ones?
- How
is this reflected in your Size-Class Frequency
plots?
- What
biotic processes are involved?
- Interpretation:
Readings on the Ribbon Forest –
- Review
readings in LC
on Ribbon Forests (p. 89-91 )
- "Ribbon Forests
and Snowglades" (pdf,
2.4M), pp. 198f. in: Knight, D. 1994. Mountains and
Plains. The Ecology of Wyoming Landscapes.
Yale Press.
click images to enlarge
See Transect 1&2
graphs composite (pdf)
|
Whiteboard discussion
|
|
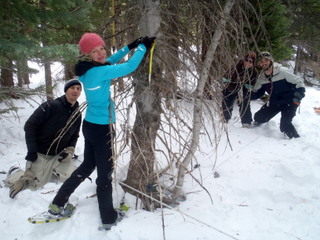
Ribbon
Forest Sampling - Upper Transect
[Photo (c) 2013 c/o Elizabeth Golden]

Ribbon
Forest Sampling - Lower Transect

Snow mold damage on Engelmann
Spruce sapling buried branches
[Photos (c) 2013 T Kittel]
|
2012
|
2/5/12
- Transect 1&2 graphs composite (pdf,
75k)
- Spreadsheets
- Transect 1 (Summary xls,
160k)
- Transect 2 (Summary xls,
160k)
|
|
2011
|
1/23/11
|

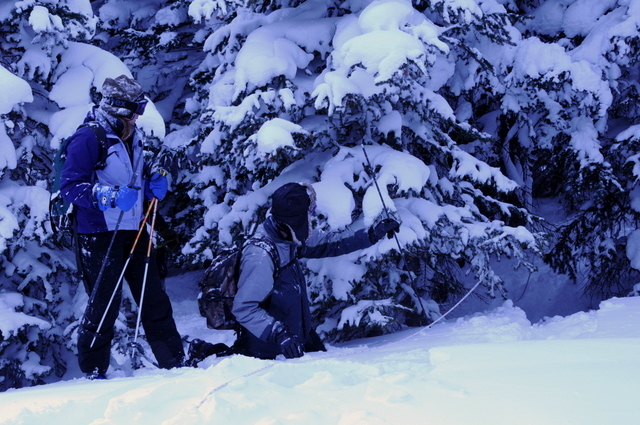
[photos:
TKittel]
|
| 2010 |
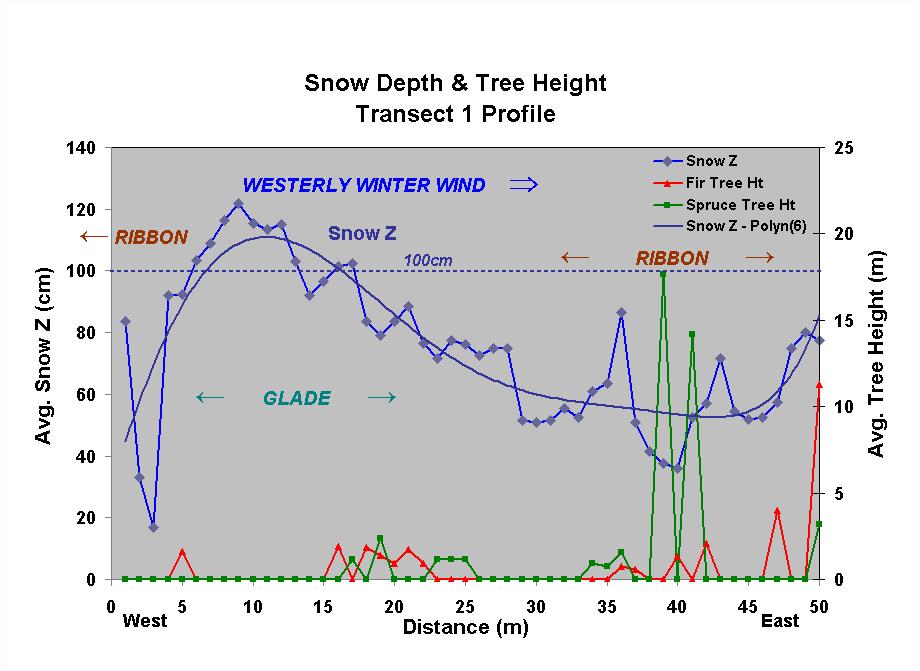
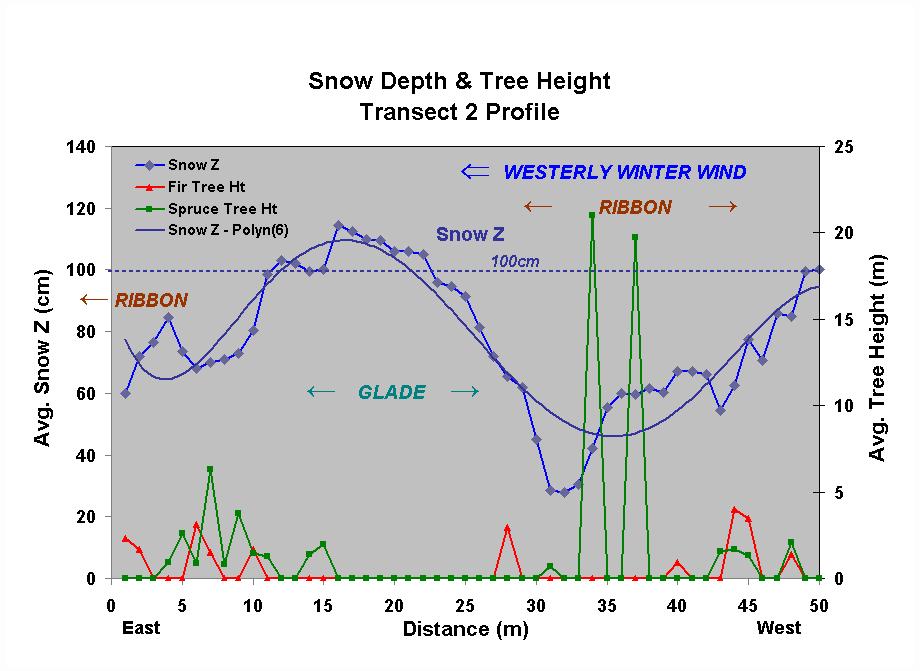
Feb 2010 -
- Transect 1: plots (pdf,
200k), spreadsheet (xls,
260k)
- Transect 2: plots (pdf,
200k), spreadsheet (xls,
260k)
- Figure composite (pdf,
1M)
Transect 2
[photos: TKittel]
|
|
click image to
enlarge
|
| 2009 |
Ribbon
Forest (2/28/09) –
- Plots:(jpg's, <70k)
- Transect 1
Profile -
- N.B. -
On the next 3 plots, ignore the minor,
rightmost bump on the polynomical fit - this is an
artifact of the fit.
- Data - xls
(100k), Selected plots as Handout (pdf,
160k)
- Blackboard
photo (jpg,
700k)
|
|
| 2008 |
1 March 08 - Ribbon
Forest Structure -- Plots in: xls
(100k) |
|
| 2005 |
Feb 2005 Spruce-Fir
Vegetation Survey (xls,
25k) |
|


